
Choose a sensor, read a quantity, calibrate, transmit and analyse the measurements with FizziQ.
Measuring the temperature of a liquid as it cools, tracking the CO₂ level of a classroom over a full day, or building a lux meter no longer requires a proprietary data-logging interface. A programmable board — Arduino, micro:bit or ESP32 —, a sensor and display software are enough to form a complete science laboratory. The point of this guide is not to teach programming: it is to turn a circuit that displays numbers into an instrument whose unit, resolution, limits and uncertainty you actually know.
Just looking to connect a sensor to FizziQ? See the guide Connecting external sensors to FizziQ: Bluetooth, USB, message formats and compatible sensors. In one sentence: this guide explains how to build the instrument, that page explains how to connect it to FizziQ.
In brief
How do you do science with a microcontroller?
You connect a sensor to a programmable board. The board reads the signal, converts it into a physical unit, then sends it over USB or Bluetooth to an app such as FizziQ or phyphox, a spreadsheet or a Python program. There you display, record and analyze the measurements. The scientific value of the activity comes from the protocol, the calibration, the analysis and the interpretation — not from the circuit itself.
Choose your method
You are using FizziQ Connect. Plug in the sensor, switch on the box and select it under “External sensors” in FizziQ. No programming, no wiring. → § 2
You want to connect Arduino, micro:bit or ESP32 to a smartphone. Program the board to send its measurements over Bluetooth Low Energy in the text format FizziQ expects. → § 4.2
You want to connect the board to a computer. Plug it in over USB: FizziQ Web reads the measurements sent over the serial port. → § 4.1
The data path is the same in every case:
Sensor → microcontroller → USB or Bluetooth → FizziQ or phyphox → graph → experiment notebook or export.
Throughout this guide we will mainly use FizziQ and FizziQ Web to display and analyze the measurements: their open text protocol saves you from building an interface, data acquisition over Bluetooth Low Energy or USB is built in, and the external sensor joins the smartphone’s sensors, the graphs and the experiment notebook in a single environment — an affordable alternative to proprietary data-logging interfaces. We will also cover phyphox, the serial monitor, spreadsheets and Python whenever those tools fit the need better. This guide is written for physics and chemistry, biology and earth science, and technology teachers, with no prior electronics experience assumed.
Don’t want to program or wire anything?
FizziQ Connect lets you plug in compatible off-the-shelf sensors directly and stream their measurements to FizziQ over Bluetooth. The box recognizes the sensor at power-on; class time goes entirely to the experiment. Discover FizziQ Connect · See the compatible sensors
1. The full picture: from sensor to analysis
A microcontroller is a small programmable computer system integrated on a single chip. Unlike a general-purpose computer, a microcontroller board typically runs one dedicated embedded program, launched automatically at power-on, with no user interface and no general-purpose operating system. The processor contributes to peak performance, but the actual acquisition rate is most often limited by the sensor’s response time, the converter, the communication bus or the data transmission.
Every instrumented measurement follows the same chain:
Physical quantity → sensor → electrical signal → digital conversion → processing → transmission → display → analysis → interpretation.
Five objects not to confuse along this chain:
| Object | Role | Example |
|---|---|---|
| Sensor | Turns a physical quantity into a signal | DS18B20 probe, CO₂ sensor |
| Microcontroller | Programmable chip that reads, processes, transmits | ATmega328P, nRF52833, ESP32 |
| Development board | Makes the microcontroller usable: connectors, power, USB | Arduino UNO, micro:bit, ESP32 DevKit |
| Single-board computer | Full computer with an operating system | Raspberry Pi |
| Data-acquisition interface | Ready-to-use box that digitizes and transmits | FizziQ Connect, commercial data loggers |
Key point
A microcontroller generally does not measure a physical quantity directly. It reads the signal supplied by a sensor, processes it, then records or transmits it. The sources of error lie in the sensor, the wiring, the conversion and the calibration — rarely in the microcontroller itself.
Why add this chain to a smartphone that already measures a great deal with FizziQ? For four reasons: to reach quantities the phone cannot measure (probe temperature, CO₂, pH, soil moisture, force, voltage); to automate long-duration measurements (a night, a week); to build an instrument in which every choice — sensor, range, sampling rate, processing — becomes something the class can debate; and to make visible the measurement chain that a commercial instrument hides. A multimeter displays “23.4 °C”; a home-built setup first displays “478”, and the path from 478 to 23.4 °C becomes an object of study.
2. Arduino, micro:bit, ESP32 or FizziQ Connect: which one to choose?
There is no best board — only boards suited to different goals. Many schools use several.
| Solution | Programming | Wiring | Built-in sensors | Wireless | Learning curve | Recommended use |
|---|---|---|---|---|---|---|
| Arduino | Arduino/C++, MicroPython on some boards | Often required | None on the classic boards | Depends on the model | Intermediate | Building an instrument, understanding electronics |
| micro:bit | Blocks (MakeCode) or Python | Minimal (crocodile clips) | Accelerometer, magnetometer, light (arbitrary units), processor temperature | Bluetooth Low Energy | Easy | First measurement activities, middle school |
| ESP32 | Arduino/C++, MicroPython | Required | None usable for physics | Wi-Fi and Bluetooth depending on the variant | Intermediate to advanced | Connected acquisition, long-duration measurements |
| FizziQ Connect | None | Keyed Grove connectors | 30+ off-the-shelf sensors to plug in | Bluetooth Low Energy to FizziQ | Immediate | Focusing on protocol and analysis |
Arduino is an ecosystem of boards, tools and libraries, extremely well documented. Its breadboard wiring is an asset in technology classes and a source of failures in lab sessions. Beware: wireless connectivity depends on the model — a UNO R3 has neither Bluetooth nor Wi-Fi, while a Nano 33 BLE or a UNO R4 WiFi provide Bluetooth Low Energy.
micro:bit was designed for education: block programming, built-in sensors, immediate handling — and it can genuinely serve as a scientific instrument, provided you know its limits. Two important scientific caveats: its temperature sensor measures the processor’s temperature, not the air’s — an excellent prop for discussing systematic bias, not a room thermometer — and its “light level” is expressed in arbitrary units from 0 to 255, not in lux. Two versions coexist (V1 and V2, the V2 recognizable by its notched edge connector); check which one you own before preparing a teaching sequence.
ESP32 is a family of Espressif microcontrollers: powerful, with Wi-Fi and, on most variants, Bluetooth Low Energy. No built-in sensor usable for physics: it is an acquisition platform, not an instrument. It is the natural choice for connected projects, with a technical level slightly above the micro:bit.
FizziQ Connect is not a fourth family of microcontrollers: it is a data-acquisition interface built around an ESP32 module (M5Stack), pre-loaded, with a screen, a battery and Grove connectors. It recognizes at power-on more than thirty off-the-shelf sensors (Grove, M5Stack, Seeed Studio, DFRobot), displays the measurements, records them and streams them to FizziQ over Bluetooth — without a single line of code. Developed with the La main à la pâte Foundation. It is the no-programming alternative to Arduino, micro:bit or ESP32 for the acquisition chain — in one formula: you want to build? a programmable board; you want to measure? FizziQ Connect. Details, compatible sensors and broadcast modes: FizziQ Connect page and user manual.
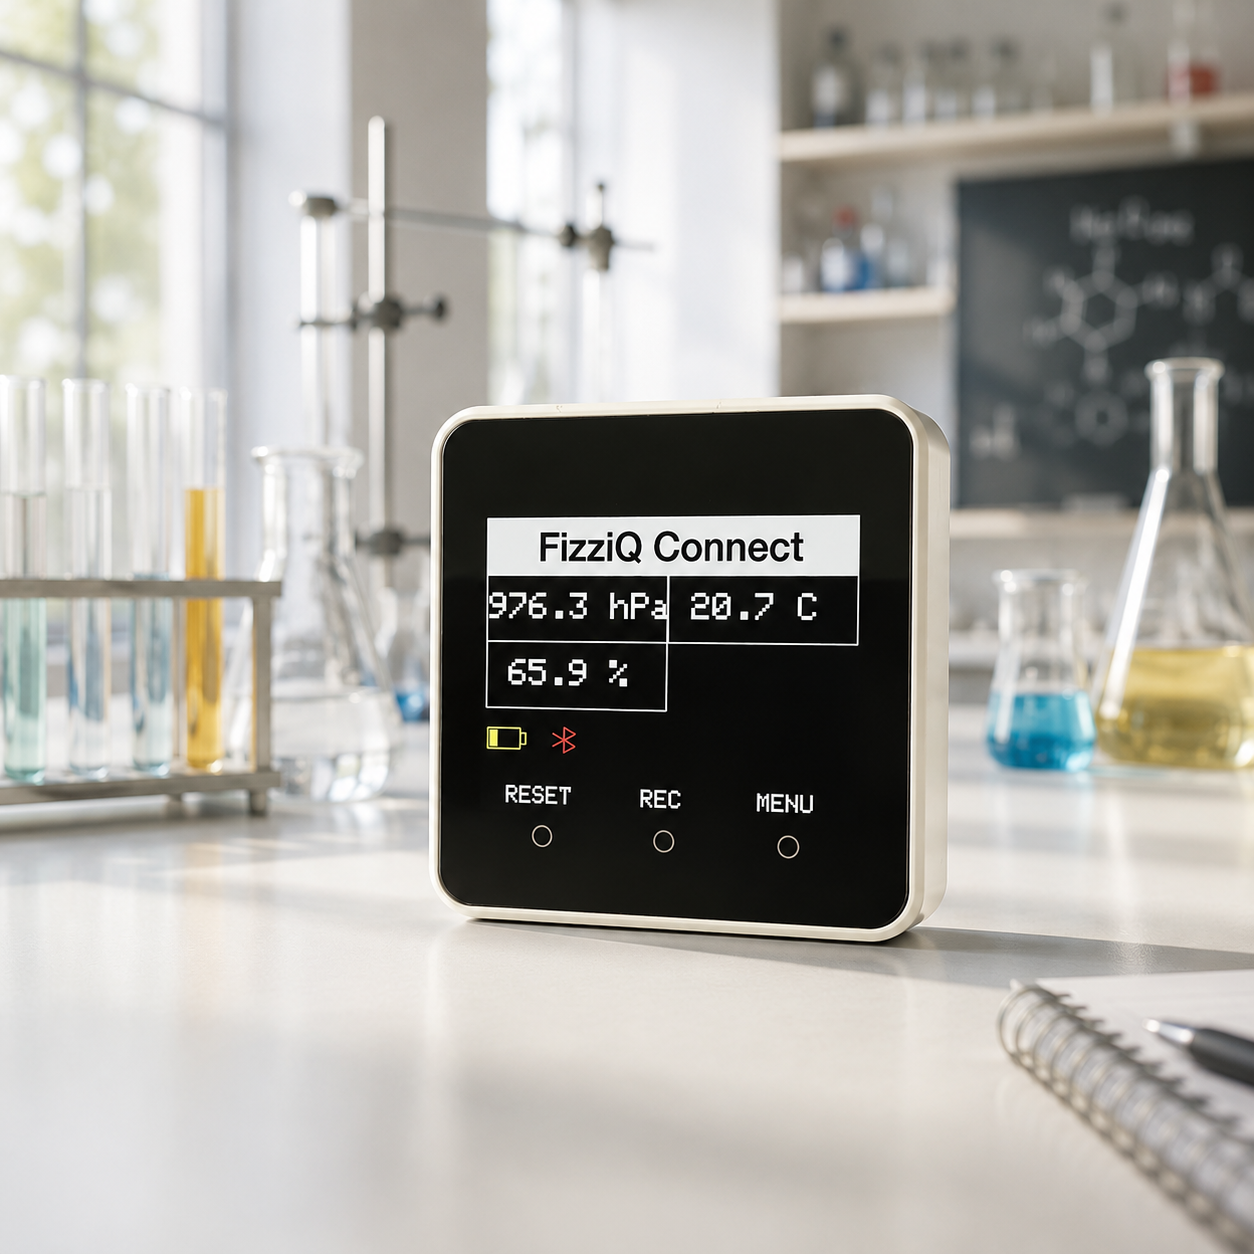 FizziQ Connect: a ready-to-use box that recognizes sensors at power-on and streams measurements to FizziQ, with no wiring or programming.
Practical guidance: micro:bit to get started quickly; Arduino to understand and build; ESP32 for connected projects; FizziQ Connect to measure without building the technical interface.
Check before buying
Radio capabilities vary within each family: some ESP32 variants have no Bluetooth, most classic Arduino boards none either, and micro:bit V2-specific blocks do not run on a V1. Always consult the board’s official datasheet, never a tutorial alone.
3. Understanding the measurement chain through an example
Let us follow a temperature probe immersed in a beaker.
- The physical quantity is the temperature of the liquid. It exists independently of any instrument.
- The sensor exploits a physical phenomenon: a thermistor’s resistance varies with temperature, non-linearly; a DS18B20 probe integrates the sensor and its conversion electronics.
- The signal is either a voltage (analog sensor) or a bit stream (digital sensor).
- The reading: an analog input samples a voltage within a set range and converts it into a digital value; a digital sensor communicates over a bus (I²C, 1-Wire).
- The conversion applies a calibration relationship: this is where the raw value becomes degrees Celsius.
- Timestamping attaches an instant to each value — without it, no curve and no model.
- Transmission, over USB or Bluetooth Low Energy.
- Display, recording, analysis and interpretation, in FizziQ or the tool of your choice.
On the analog/digital distinction, keep the essential point: an analog sensor delivers a voltage that your program must digitize and convert; a digital sensor transmits digital data over a bus, with simpler wiring. But the transmission protocol says nothing about accuracy: a cheap digital sensor, badly placed or uncalibrated, measures worse than a carefully handled analog one.
Going further. A digital sensor does not always deliver a ready-to-use value: some transmit raw registers that still need converting using the sensor’s internal calibration coefficients, found in its datasheet. Manufacturer libraries usually do this work — a good reason to prefer them over copied code.
4. Connecting and displaying the data
This is where an electronics project turns into a scientific activity. Whichever route you choose, the logic of the acquisition program is always the same:
initialize the sensor and the communication

repeat:
    read the raw value
    convert it into a physical unit
    attach a time to the measurement
    check that the value is plausible
    filter if necessary
    transmit or record
    keep to the chosen pace
Changing boards or languages means rewriting these operations in another syntax, never changing the approach. Always start with the serial monitor of your programming environment: it is the debugging tool that lets you check that a sensor responds and that the message format is correct, before connecting anything else.
4.1 USB to FizziQ Web
On a computer, FizziQ Web reads the text lines the board sends over its serial port: one measurement per line, with no library or driver required. The data lands in the FizziQ Web experiment notebook, with tables, graphs, curve fitting, CSV, Python and PDF export, and a final report. Once your program computes the measurement correctly, sending it takes just two lines of code: the message format, the full list of recognized prefixes, step-by-step connection and troubleshooting are covered in the guide Connecting external sensors to FizziQ.
4.2 Bluetooth to FizziQ
On a smartphone or tablet, FizziQ detects Bluetooth Low Energy devices from the “External sensors” screen, with no prior pairing in the phone’s settings. The external sensor then behaves exactly like a built-in sensor: same displays, same record button, same timestamps as the smartphone’s sensors — which allows a direct comparison between an external and an internal measurement within the same recording. Each acquisition becomes a card in the experiment notebook, exportable as CSV, Python, image or QR code. Here too, the full protocol — message format, recognized prefixes, code examples — is covered in the guide Connecting external sensors to FizziQ.
4.3 Bluetooth to phyphox
phyphox, developed at RWTH Aachen University, offers the phyphox BLE library for Arduino and ESP32. Its logic is different: the structure of the experiment — graphs, channels, labels — is defined in the microcontroller’s program, then transmitted to the app. The minimal example fits in two instructions (PhyphoxBLE::start() then PhyphoxBLE::write(value)), and communication can run in both directions. Supported boards and examples: official phyphox-arduino repository.
4.4 CSV, spreadsheets and Python
The CSV file — one timestamped measurement per line — is the pivot format of the whole chain: FizziQ, FizziQ Web and FizziQ Connect all export to CSV. A spreadsheet suits simple regressions and draws on a skill already practiced in mathematics; Python enables model fitting, uncertainty propagation and reproducible processing, at the cost of extra skills. FizziQ and FizziQ Web export an observation directly as a Python script, which spares you the tedious data formatting.
4.5 FizziQ or phyphox?
phyphox and FizziQ both let you display data from a microcontroller on a mobile device, but their pedagogical logic differs.
| Criterion | phyphox | FizziQ |
|---|---|---|
| Connection | Bluetooth Low Energy | Bluetooth Low Energy (mobile and Web); USB (FizziQ Web) |
| Programming | Yes, with the phyphox BLE library | Yes (text lines in an open format); none with FizziQ Connect |
| Display interface | Defined from the microcontroller’s program | Provided by the app, as for built-in sensors |
| Smartphone sensors | Usable, with possible transmission to the board | In the same recording as the external sensors |
| Analysis and export | Analysis and export tools specific to each phyphox experiment | Built-in experiment notebook, PDF, CSV and Python export, final report |
| Preferred use | Designing a custom mobile experiment from code | Bringing external measurements into a complete experimental workflow |
phyphox is particularly suited when the developer wants to define a custom mobile experiment from the microcontroller. FizziQ is particularly suited when external measurements need to join a broader environment — acquisition, analysis, experiment notebook, report. This is guidance, not a rule: both apps are free, and nothing prevents you from using one for a technology project and the other for physics and chemistry lab work.
Check before the lesson
These parameters depend on current versions and are detailed in the documentation: browsers supporting Bluetooth and USB in FizziQ Web (Chromium-based only at the time of writing — Firefox and Safari implement neither Web Bluetooth nor Web Serial); recommended sending pace (a few hundred milliseconds); maximum number of points per recording in FizziQ and FizziQ Connect; recognized sensor labels, which differ in part between the USB and Bluetooth protocols. Consult the FizziQ manual and the FizziQ Web manual before setting up the room.
5. From raw data to a scientific measurement
A setup that displays “23.4718 °C” has not produced a measurement: it has produced a number. This section is the heart of the guide.
5.1 Raw value and unit
A microcontroller may read an integer from a converter, a voltage, a digital frame or a value already converted. In the first three cases, your program decides the relationship between the number read and the physical quantity — and that relationship can be wrong. It must always come from the datasheet of the sensor you are using, never from copied example code: the voltage × 100 conversion valid for a sensor delivering 10 mV per degree is wrong for a thermistor, whose response is not linear.
5.2 Resolution is not accuracy
In theory, a 12-bit converter over a 3.3 V range distinguishes about 0.81 mV per step, versus 4.9 mV for a 10-bit converter over 0–5 V. This figure is an ideal coding resolution, not real accuracy. Four decimal places on a display do not make a measurement exact: correctness depends on calibration, power-supply stability and circuit noise.
Going further. The analog converter of many ESP32 boards is non-linear, especially at the ends of its range, and its response depends on the configured attenuation and calibration. Moreover, Wi-Fi transmission causes current draws that add noise to the analog inputs: better to acquire first and transmit afterwards than to transmit during acquisition.
5.3 Sampling rate
Choose it from the phenomenon, not from the board’s capabilities:
| Phenomenon | Order of magnitude of the interval | Note |
|---|---|---|
| Cooling of a liquid | 1 to 10 s | The phenomenon lasts tens of minutes |
| CO₂ tracking, weather | 10 s to 5 min | The sensor itself is slow |
| Mechanical oscillation (T ≈ 1 s) | 20 to 50 ms | At least 20 points per period |
| Sound signal | < 25 µs | Beyond a BLE link: use the smartphone’s microphone |
Two points per period is an absolute theoretical limit, never a target: aim for ten to twenty points per period. And the transmission route imposes its own limit — with a Bluetooth send every few hundred milliseconds, you cannot follow a phenomenon that varies within tens of milliseconds.
5.4 Noise and filtering
Four tools, in order of increasing aggressiveness: averaging several closely spaced readings, a moving average, a median (effective against isolated outliers), and the exponential filtering offered in FizziQ’s settings. Filtering smooths a curve, but it can also hide a real variation and erase the very peak that was the object of study. An honest classroom rule: show the raw curve, then the filtered curve, and discuss what was lost.
5.5 Calibration
Compare the instrument to a reference, within one lesson: place the probe and a reference thermometer in the same well-stirred bath; record at least five value pairs across the useful range, at thermal equilibrium each time; plot measured versus reference; fit a straight line and derive a correction; then verify the instrument on a point that was not used for calibration — the step everyone forgets, and the one that actually validates the work. See the calibration glossary entry.
5.6 Uncertainty
The final quality depends on the entire chain: sensor, circuit, power supply, conversion, calibration, environment, processing, transmission.
The quality of a measurement depends as much on the sensor, its calibration and the protocol as on the number of digits displayed.
To go further: analyzing measurement uncertainty.
6. Choosing a sensor
The choice starts from the quantity to be measured and the question asked, never from a catalog. Ask five questions systematically: what quantity is actually measured, in what unit, over what range, with what known limits, and does it need calibrating?
| Discipline | Accessible quantities | Typical caveats |
|---|---|---|
| Physics | Temperature, illuminance, distance, pressure, force, voltage, current | A probe’s thermal inertia smooths fast variations; a light sensor saturates in full sunlight; never measure mains voltage |
| Chemistry | Temperature, pH, conductivity, gases, colorimetry | pH requires at least a two-point calibration and drifts; conductivity depends strongly on temperature |
| Biology and environment | CO₂, air and soil humidity, light, fine particles, heart rate | An “eCO₂” sensor (SGP30) estimates CO₂ from VOCs while an infrared sensor (SCD40) measures it: they are not interchangeable; a soil-moisture probe measures a conductance or a capacitance, not a water content; a pulse sensor is not a medical device |
The examples cited (DS18B20, BH1750, SCD40, SGP30, VL53L0X, SHT30…) are among the verified sensors compatible with FizziQ Connect; other equivalent parts work with a programmed board. Detailed overview: fifteen sensors for studying science (in French).
7. Six essential experiments
For each experiment: the question, the sensor, the protocol in brief and, above all, the limits — that is where scientific training happens. Check the compatibility of your sensor with your board and your app version.
7.1 Cooling of a liquid
Question: how does the temperature of a hot liquid left in a room evolve? Middle to high school, physics and chemistry. Waterproof DS18B20 probe in a beaker of water at 60 °C maximum; one measurement every 5 s for 30 min; plot T(t) and fit an exponential model to the difference from room temperature. Limits: the probe’s thermal inertia, evaporation and stirring all shape the curve; the exponential model assumes a moderate temperature difference and a homogeneous medium.
7.2 Illuminance and distance from the source
Question: how does illuminance vary with distance? High school, physics. BH1750 sensor facing a point-like lamp in a dark room; readings every 5 cm from 10 cm to 1 m; plot E against 1/d². Limits: the inverse-square law only holds for a near-point source, with no reflections; measure the ambient light with the lamp off and subtract it; beware of saturation. Related activity: illuminance and distance from the source.
7.3 Tracking CO₂ in a classroom
Question: how does the concentration evolve during a lesson, then after airing the room? Middle to high school, biology and physics-chemistry. Infrared SCD40 sensor away from faces; one measurement every 30 s; note window openings in the experiment notebook; identify the rising slope and the decay after airing. Limits: response time of several tens of seconds; do not confuse with an eCO₂ sensor; auto-calibration assumes regular exposure to outdoor air.
7.4 Weather station
Question: how do temperature, pressure and humidity evolve together over several days? Middle to high school, biology and physics-chemistry. Combined SHT30 + QMP6988 sensor shielded from direct sunlight; one measurement every 5 min; overlay the series, look for correlations, compare with a nearby official station. Limits: the enclosure’s self-heating biases the temperature; relative humidity depends on temperature; pressure varies by about 12 hPa per 100 m of altitude.
7.5 Ultrasonic rangefinder
Question: how far can you trust an ultrasonic distance measurement? Middle to high school, physics and technology. Ultrasonic module on Arduino or ESP32; compare measured and true distance from 5 cm to 3 m, then vary the angle and the nature of the target. Limits: the calculation assumes a speed of sound of about 343 m/s at 20 °C, which increases by about 0.6 m/s per degree; dead zone at short range, conical beam, poor reflection off soft or slanted surfaces. Extension: correct with the actual air temperature — a fine example of coupling two sensors.
7.6 Soil moisture and evaporation
Question: how fast does soil dry out, and what does it depend on? Middle to high school, biology. Capacitive probe in identical pots; one measurement every 10 min over several days, varying only one condition; compare drying rates. Limits: the probe measures a conductance or a capacitance, not a water content — the displayed percentage is a convention; resistive probes corrode; a calibration by weighing gives the measurement its meaning.
From guide to lesson. Each of these experiments can be linked to a complete FizziQ activity — protocol, activity opened in the app via QR code, sample dataset for the analysis session. The illuminance and distance from the source activity is one example, and the activity catalog offers more than one hundred ready-to-use protocols.
Four further leads
To go further, four experiments requiring a programmed circuit are sketched here: the charging of a capacitor (RC circuit at extra-low voltage exclusively, exponential fit of the time constant); the pendulum (where the smartphone’s accelerometer, sampled at 50–100 Hz by FizziQ, is often better suited than an external sensor transmitted over Bluetooth — knowing when to give up the circuit is part of the method); the conductivity of a solution (dedicated probe with alternating excitation, calibration series, controlled temperature); and the regulated greenhouse (sensor, threshold, hysteresis and low-voltage actuator under supervision — clearly separating acquisition from control).
8. Three pedagogical levels: use, modify, design
The same experiment can be run at three depths, which lets you reuse it from middle school to university.
Level 1 — Use. An assembled, programmed system or a ready-to-use box: class time goes entirely to the protocol, the variables, the graphs and the interpretation. Using is not pedagogically inferior to programming: the objectives are different.
Level 2 — Modify. Students change one parameter of a supplied program: interval, calibration constant, threshold, unit. Each modification becomes a hypothesis to test. It is the most neglected level and the best ratio of time invested to learning gained.
Level 3 — Design. Choice of sensor, wiring, program, validation against a reference, documentation of the limits, presentation of the instrument. The natural format for an interdisciplinary project or an oral defense.
9. Organization and safety
Before the lesson. Test every board, every sensor and every USB cable — many cables carry only power, not data. Number the kits, print a wiring diagram, prepare a backup program already uploaded and a backup dataset that will save the analysis session in case of failure. Give each Bluetooth device a distinct name: eight devices with the same name will disorganize an entire class.
During the lesson. Explicitly separate assembly time from experiment time. Assign roles (assembly, program, protocol, data, reporter) and rotate them. Have students document in the experiment notebook every program change and every acquisition parameter. Have the data exported before anything is dismantled; in FizziQ, QR-code sharing broadcasts an observation to the whole class without an Internet connection.
Safety — non-negotiable rules.
- Extra-low voltage only; never any connection to the mains, never any measurement of mains voltage.
- Check polarities before powering up: a reversal can destroy a sensor or a board, and some sensor ranges reverse their poles despite identical connectors.
- Disconnect the power before any change to the circuit; prevent short circuits.
- Respect the maximum voltage of the analog inputs (typically 3.3 V) and the current limits of the pins: an actuator is driven through a power stage and a separate supply.
- Keep boards away from liquids; immerse only probes designed for it; handle lithium batteries with care.
- Supervise at all times any experiment involving heating or an actuator; apply the usual laboratory rules for chemistry and biology; clean the probes after use.
10. Quick troubleshooting
The six most frequent failures in class, and the first thing to check:
| Problem | First check |
|---|---|
| The board is not detected | Bluetooth enabled on the device; Chromium browser for FizziQ Web; USB data cable (many carry power only) |
| The sensor appears but no value arrives | Exact message format (covered in the external sensors guide); check the stream in the serial monitor first |
| The displayed unit is wrong | The sensor’s prefix or label: it determines the instrument and the unit in FizziQ |
| The curve is unstable or absurd | Sending pace too high; power supply; conversion copied from an example unsuited to the sensor; filtering |
| Several groups see the same board | Give each device a unique Bluetooth name before the lesson |
| The connection drops during a recording | Power or battery; device sleep mode; distance and obstacles |
If the problem persists: serial monitor first (is the stream leaving the board?), documentation next (FizziQ, FizziQ Web, external sensors).
11. Frequently asked questions
What is the difference between Arduino and ESP32? Arduino is an ecosystem of boards and tools; ESP32 is a family of microcontrollers designed by Espressif, which incidentally programs very well in the Arduino environment. The ESP32 offers more power and built-in wireless; classic Arduino boards are simpler and more tolerant at 5 V.
Do you need to know how to program to use a microcontroller? No. A ready-to-use box such as FizziQ Connect recognizes sensors at power-on and streams the measurements without a line of code; only analog sensors require a metrology-style configuration (name, unit, values at 0 V and 3.3 V). Programming becomes necessary for an unsupported sensor or custom behavior.
Do all Arduinos have Bluetooth? No. A UNO R3 board has neither Bluetooth nor Wi-Fi. The Nano 33 BLE and UNO R4 WiFi boards provide Bluetooth Low Energy. Always check the board’s official datasheet: it is the most frequent mistake in online tutorials.
Can you connect an Arduino to a smartphone? Yes, if the board has Bluetooth Low Energy or if a BLE module is added. The smartphone then receives the measurements in FizziQ or in phyphox, depending on the format and library used.
What is the difference between FizziQ and phyphox? phyphox lets you define the mobile experiment from the microcontroller’s program, through its phyphox BLE library. FizziQ brings the external sensor in as one instrument among others, alongside the smartphone’s sensors, the graphs and the experiment notebook, all the way to the exported report. Two different logics, two free apps.
Can you use FizziQ without FizziQ Connect? Yes. FizziQ works first with the smartphone’s own sensors, and accepts any Bluetooth Low Energy microcontroller — Arduino, micro:bit, ESP32 — that sends its measurements in the documented format. The protocol is open and requires no particular hardware.
What sampling rate should you choose? The one the phenomenon dictates: ten to twenty points per period for a periodic signal, a few seconds between points for a cooling curve, several minutes for environmental monitoring. Too fast saturates the link; too slow makes the phenomenon disappear.
Can you record measurements for several hours? Yes, by sizing the acquisition: at one measurement every 10 s, a few thousand points cover about a dozen hours. Check your app’s point limit in its documentation, and plan the power supply — a permanent USB link is safer than a battery for a 24-hour run.
Are measurements from a cheap sensor reliable? They can be, provided you know their limits. An inexpensive sensor is often sufficient to compare situations or follow a trend; rarely to produce an absolute reference value. Calibration, repeatability and control of the conditions matter more than the component’s price.
12. Resources and related activities
- Discover FizziQ Connect and its list of compatible sensors.
- Connecting an external sensor to FizziQ: Bluetooth protocol, prefixes, examples, troubleshooting.
- Connecting external sensors to FizziQ: message format, recognized prefixes, Arduino, ESP32 and micro:bit examples, over Bluetooth and USB.
- Fifteen sensors for studying science (in French).
- Analyzing measurement uncertainty and calibration in the glossary.
- Explore the FizziQ science activities.
Guide checked against official sources on July 31, 2026. Hardware characteristics and software compatibility evolve: consult the documentation before buying a sensor or preparing a lesson.