
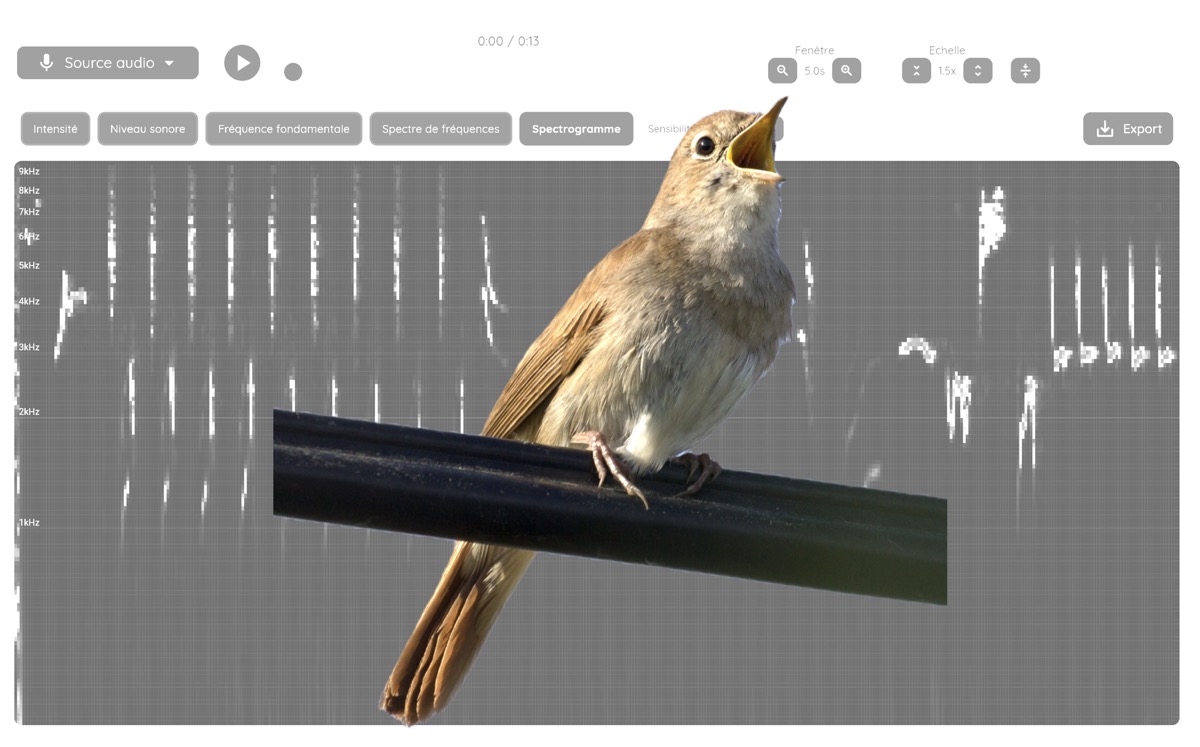
Spectrogram of bird song
Analyze the spectrogram of bird songs to identify their acoustic signature.
Activity Summary
The student imports a bird song recording into FizziQ Web and uses the spectrogram to visualize frequencies and temporal structure. They identify sound sequences, measure their duration and periodicity, and determine the frequency range used by the species. By comparing spectrograms of two different species, they understand how spectral signatures allow bird identification.
Introduction
Every morning, well before the alarm goes off, birds begin their concert. This is no coincidence: each species has its own distinctive song, a true acoustic identity card shaped by evolution. The common nightingale, a recognized virtuoso of the avian world, chains melodic sequences of a complexity that has fascinated ornithologists for centuries. In contrast, the great tit contents itself with two or three notes repeated with metronome regularity.
How do we distinguish these songs objectively, beyond the human ear? The spectrogram, an analysis tool that simultaneously represents a sound's frequencies and their evolution over time, provides an immediate visual answer. On this display, each species' song draws a unique pattern, as recognizable as a fingerprint.
This is precisely the principle exploited by bird recognition apps like Merlin or BirdNET: by analyzing the time-frequency structure of the song, an algorithm can identify the species with remarkable reliability. In this activity, you will use the FizziQ Web Audio Analysis module to visually decode bird songs and understand the science behind these recognition algorithms.
Learning Objectives
- Use the FizziQ Web spectrogram to visualize a complex sound signal
- Identify and measure characteristic frequencies of a bird song
- Measure the duration and periodicity of sound sequences
- Compare spectral signatures of two different species
- Understand the principle of automated acoustic recognition
Scientific Concepts
Instruments and sensors
Scientific instruments
- Sound spectrum analyzer (spectrogram / spectrum at cursor)
Sensors
- Microphone
FizziQ Features
- Audio file import — Loads a pre-recorded bird song file (personal recording or a download from xeno-canto.org) into the Audio Analysis module.
- Experiment notebook — Exports the spectrogram images and records the comparative observations made on the two bird species.
Required Materials
- - Computer with browser and access to FizziQ Web - Bird song audio file (personal recording or downloaded from xeno-canto.org) - Headphones or speakers (recommended) - FizziQ experiment notebook - Note: the protocol remains adaptable to any comparable spectral analysis tool.
Experimental Protocol
Obtain a bird song recording. Two options: record a bird directly in nature with your smartphone microphone, or download an audio file from a specialized site like xeno-canto.org. The common nightingale is an excellent choice for beginners.
Open FizziQ Web in a browser at fizziqweb.web.app.
Access the Audio Analysis module by clicking Experiment in the left sidebar, then selecting Audio Analysis.
Load the audio file: click the Audio Source button, select File, then choose the prepared audio file.
Select the Spectrogram visualization mode to display the time-frequency representation of the song.
Adjust the frequency range with the Scale button to visualize the entire song. For the nightingale, a range of 0 to 10,000 Hz is recommended.
Adjust detection sensitivity with the Sensitivity button to highlight song patterns.
Identify different sequences of the song, i.e., groups of sounds separated by silences. Measure each sequence's duration using the time cursor.
Observe if certain sequences repeat and measure the periodicity of these repetitions.
Switch to Spectrum at cursor mode to measure minimum and maximum frequencies used by the bird at different moments of the song.
Return to Spectrogram mode and describe the shape of observed patterns: rising frequency, falling, rapidly oscillating, or stable.
Export the spectrogram to the experiment notebook by clicking Add to notebook. Choose image export.
Repeat steps 4-11 with a recording of a second species (e.g., great tit) to compare spectral signatures.
Record comparative observations in the experiment notebook: frequency range, sequence duration, pattern complexity, periodicity.
Expected Results
The nightingale spectrogram shows complex patterns in curves and arabesques extending from about 1,000 to 8,000 Hz, with rapid frequency modulations. Song sequences typically last 0.5 to 2 seconds, separated by brief silences. Some sequences repeat at regular intervals.
The great tit spectrogram shows a much simpler pattern: two or three narrow horizontal bands around 3,000 to 5,000 Hz, repeated regularly with very stable period.
Visual comparison between the two spectrograms highlights striking differences in complexity, frequency range, and temporal structure.
Scientific Questions
- Why is the spectrogram more suitable than a simple spectrum for analyzing a bird song?
- How do you explain that the nightingale's song covers a much wider frequency range than the great tit's?
- What information does a recognition algorithm extract from the spectrogram to identify a species?
- How does ambient background noise affect spectral analysis quality?
- Why is there a trade-off between temporal and frequency resolution in the spectrogram?
Scientific Background
Bird song is a complex sound signal whose analysis relies on the same tools used for any acoustic signal: frequency decomposition by Fourier transform. The spectrogram represents the temporal evolution of a sound's frequency spectrum, with time on the x-axis, frequency on the y-axis, and intensity coded by color. It is a tool particularly suited for studying bird songs because it allows simultaneous visualization of sound pitch, duration, and internal structure.
Each species produces a characteristic song that constitutes its acoustic signature. The common nightingale, for example, uses a frequency range approximately from 1,000 to 8,000 Hz, with very rapid modulations that produce curved and arabesque patterns on the spectrogram. In contrast, the great tit emits a much simpler song, composed of two or three repeated notes, occupying a narrow frequency band around 3,000 to 5,000 Hz.
Bird recognition apps like Merlin or BirdNET exploit precisely these parameters: they analyze the recorded sound's spectrogram and compare it to a database of known spectral signatures, similar to a barcode reader identifying a product by its band pattern.
Extensions
- Compare spectrograms of three or more species to build an acoustic identification key
- Record the same bird at different times of day and compare spectrograms to observe possible variations
- Use Fundamental Frequency mode to follow pitch evolution during the song
- Make the recording directly outdoors and analyze background noise influence on spectrogram readability
- Compare a bird song spectrogram with that of a musical instrument playing in the same frequency range
Frequently Asked Questions
How do I obtain a good quality bird song recording?
Two reference sites offer free recordings: xeno-canto.org offers several hundred thousand recordings under Creative Commons license. Download the file in WAV or MP3 format then import it into FizziQ Web via the Audio Source button then File.
What frequency range should I set on the spectrogram?
Most songbirds produce sounds between 1,000 and 10,000 Hz. For the nightingale, a range of 0 to 10,000 Hz works well. For very high-pitched species, it may be necessary to extend to 15,000 Hz. Use the Scale button to adjust the range.
The spectrogram only shows noise, how can I improve the display?
Adjust sensitivity with the Sensitivity button to filter background noise. If the recording was made outdoors, wind and ambient noise can mask the song. Prefer a recording made in a quiet environment or download a good quality file from specialized sites.
Detailed Description
The student imports a bird song recording into FizziQ Web and uses the spectrogram (sometimes called sonogram) to visualize the frequencies and temporal structure of the song. They identify sound sequences, measure their duration and periodicity, and determine the frequency range used by the species. By comparing spectrograms of two different species, they understand how spectral signatures allow identifying a bird by its song, similar to recognition algorithms used by apps like Merlin or BirdNET. FizziQ Web's Audio Analysis module provides both the spectrogram and spectrum-at-cursor views needed for these measurements, and the built-in experiment notebook lets students export and compare the recordings' spectral signatures directly in their report.
This activity is part of our sound resources. To dig deeper into measuring and analyzing sound (waveform, spectrum, spectrogram, decibels) and find all twelve experiments, read our complete guide to measuring and analyzing sound with a smartphone or computer.
Ready to start?
Download FizziQ and try this activity with your students.