
The greenhouse effect, the cause of climate change, is difficult to demonstrate through simple experiments. Many proposals are available online, but few are truly reproducible, and many give poor physical representations of the phenomenon[1]. This article offers practical methods and accessible tools to help teachers and educators explain this phenomenon in an engaging way.
Table of Contents
A Popular Greenhouse Effect Experiment - The Challenges of the Greenhouse Effect in a Bottle - Measurement Instruments - Infrared Radiation - Conduction and Absorption - Black Body Radiation - Albedo - Identifying Greenhouse Gases - CO2 Absorption Spectrum - Stratospheric Cooling
A Popular Greenhouse Effect Experiment
What is the ideal experiment to demonstrate the greenhouse effect? When typing “greenhouse effect experiment” into a search engine, one suggestion often comes up: comparing the temperatures of two glass jars, one open and one closed, each containing a sheet of black paper at the bottom and exposed to sunlight. When one of the jars is sealed with glass or plastic, the temperature in the closed jar rises more quickly than in the open jar, reaching up to 4 to 5 degrees higher.
However, while this experiment is easy to set up and always produces convincing results, it is well established that it unfortunately does not offer a realistic representation of the phenomena at work in the greenhouse effect that warms the Earth. Indeed, if the temperature is higher in the closed jar, it is essentially because of the suppression of convection currents that cool the air in the open jar, and not because of the radiative effect called the atmospheric greenhouse effect. This explanation was proposed as early as 1774 by Swiss scientist Horace-Benedict de Saussure and confirmed in 1909 by scientist Robert Williams Wood, who showed that even when replacing the glass of a greenhouse with halite (transparent to infrared), the temperature increased similarly, proving that the observed effect is primarily related to convection. The previous experiment shows the “greenhouse” effect (or “agricultural” effect) and not the “climatic” greenhouse effect (or “atmospheric” effect).
If this experiment continues to be presented in classrooms, it is not because it offers a good representation of the phenomenon, but because it provides a simple and visual analogy useful for introducing basic concepts of the greenhouse effect, particularly for younger students. It is useful from a pedagogical point of view but proves nothing about climate change.
Should we stop there? In the following sections, we will see that it is possible to offer much more relevant representations of the atmospheric greenhouse effect phenomenon and experimentally demonstrate the radiative effect of greenhouse gases. This sometimes difficult task is amply rewarded by the intimate and precise understanding one can then have of the phenomenon.
The Challenges of the Greenhouse Effect in a Bottle
The greenhouse effect phenomenon causing climate change is well known. It is due to the fact that certain gases in the Earth’s atmosphere, such as carbon dioxide (CO2) and methane (CH4), as well as water vapor, absorb and re-emit infrared radiation emitted by the Earth’s surface. It is this radiative effect that educators and young scientists seek to demonstrate through experimental activities. However, putting this greenhouse effect “in a bottle” is harder than it seems: John Tyndall, the first to measure the radiative effect of CO2, recalls that he conducted more than 10,000 different experiments to finally prove in 1859 that carbon dioxide was a greenhouse gas[4].
The first obstacle the observer encounters is that heat transmission is a complex phenomenon resulting from the combination of three different phenomena: conduction, convection, and radiation. These phenomena coexist in most greenhouse effect experiments, making it very difficult to isolate individual effects with simple equipment[2].
This difficulty is increased by the fact that warming due to radiation is relatively small compared to other mechanisms. A radiative effect experiment involving a 20 cm layer of CO2 would produce at best a warming of one degree, most of the time less than the impact of convection or conduction[3].
Due to the small increase in heat caused by radiative phenomena, reproducibility of experiments is difficult. The smallest variations in the distance of light sources, in the choice of materials, in lamp power, in the concentration of gases used, can have a significant impact on the results obtained.
Finally, Earth’s atmosphere is a complex environment structured in several distinct layers. Each layer has specific characteristics that contribute to the greenhouse effect, and important convection phenomena help distribute heat homogeneously around the globe. Modeling such an environment in a bottle is impossible[6].
For all these reasons, there is no simple and irrefutable experiment that can be done in a classroom or at home that demonstrates the “climatic” greenhouse effect as a whole. However, it is possible to show different aspects of climate change by analogy or by measuring specific effects, as we will discover.
Measurement Instruments
What measurement instruments should be used to demonstrate the greenhouse effect and carry out the experiments we describe in the rest of this article?
The simplest and most readily available instrument is the thermometer. For more precise and long-term measurements, a digital thermometer, ideally connected to a computer or smartphone for computer-assisted experimentation (CAE), is preferable. However, the thermometer has several limitations: its reaction time is long, its placement in the enclosure is crucial, and it does not directly measure radiation.
To measure infrared radiation, a thermopile is preferred, invented by Italian physicist Leopoldo Nobili at the beginning of the 19th century. Composed of several thermocouples in series, they allow remote temperature measurement of a surface for temperatures ranging from -20°C to 350°C. Thermopiles are present in infrared thermometers but are also available as external sensors at very reasonable prices.
Another instrument for measuring infrared rays, though more expensive, is the infrared camera, capable of analyzing object radiation in image form. Infrared cameras can now be connected to a smartphone to produce infrared photos or videos. These new devices, extremely practical, allow phenomena to be analyzed in video.
In addition to temperature measurements, humidity sensors, CO2 sensors for measuring concentrations, and photoelectric cells for comparing received light intensities or measuring material albedo can be used.
All these sensors exist independently but are generally quite expensive, especially for CAE. One solution is to use hobbyist sensors connected to a microcontroller such as Arduino, ESP32, or Micro:bit. Data can be easily analyzed by connecting the controllers to the FizziQ app via Bluetooth, which allows recording and analyzing data in experiment notebooks.
For those who are not comfortable with microcontrollers, we have developed the FizziQ Connect environment, which allows CAE analyses at reduced cost compared to other educational solutions. FizziQ Connect uses M5 Stack sensors, inexpensive to purchase and sufficiently precise in this context. A wide choice is available from other manufacturers like Seed Studio.
Infrared Radiation
To understand the mechanism of the terrestrial greenhouse effect, it is essential to first address infrared radiation, or “heat radiation” as British astronomer William Herschel named it in 1800. By conducting an experiment with a prism to decompose sunlight into a spectrum of colors, Herschel observed that the temperature increased beyond red light, in an area where no visible light was present.
Although infrared radiation is not visible to the naked eye, we can feel it as heat thanks to thermoreceptors located in our skin. Some animals, such as vipers, pythons, and boas, possess heat-sensitive pits on their heads, allowing them to detect infrared heat emitted by warm-blooded prey. This gives them a significant advantage for hunting at night. Smartphone camera sensors are also sensitive to infrared rays, but to produce an image close to what the human eye sees, manufacturers add infrared-blocking filters. However, some smartphones have less effective or wider-spectrum filters, such as many budget Android smartphones. An opportunity to visualize infrared rays!
In a moderately lit location, open your smartphone’s camera app and point it at the infrared emitter of a TV remote control. Press a button on the remote while looking at the emitter through the smartphone screen. You will see a flashing light from the emitter, visible on the screen even though it is invisible to the naked eye. If your smartphone does not detect infrared, it means the camera’s infrared filter is calibrated to give an image as close as possible to what the human eye perceives.
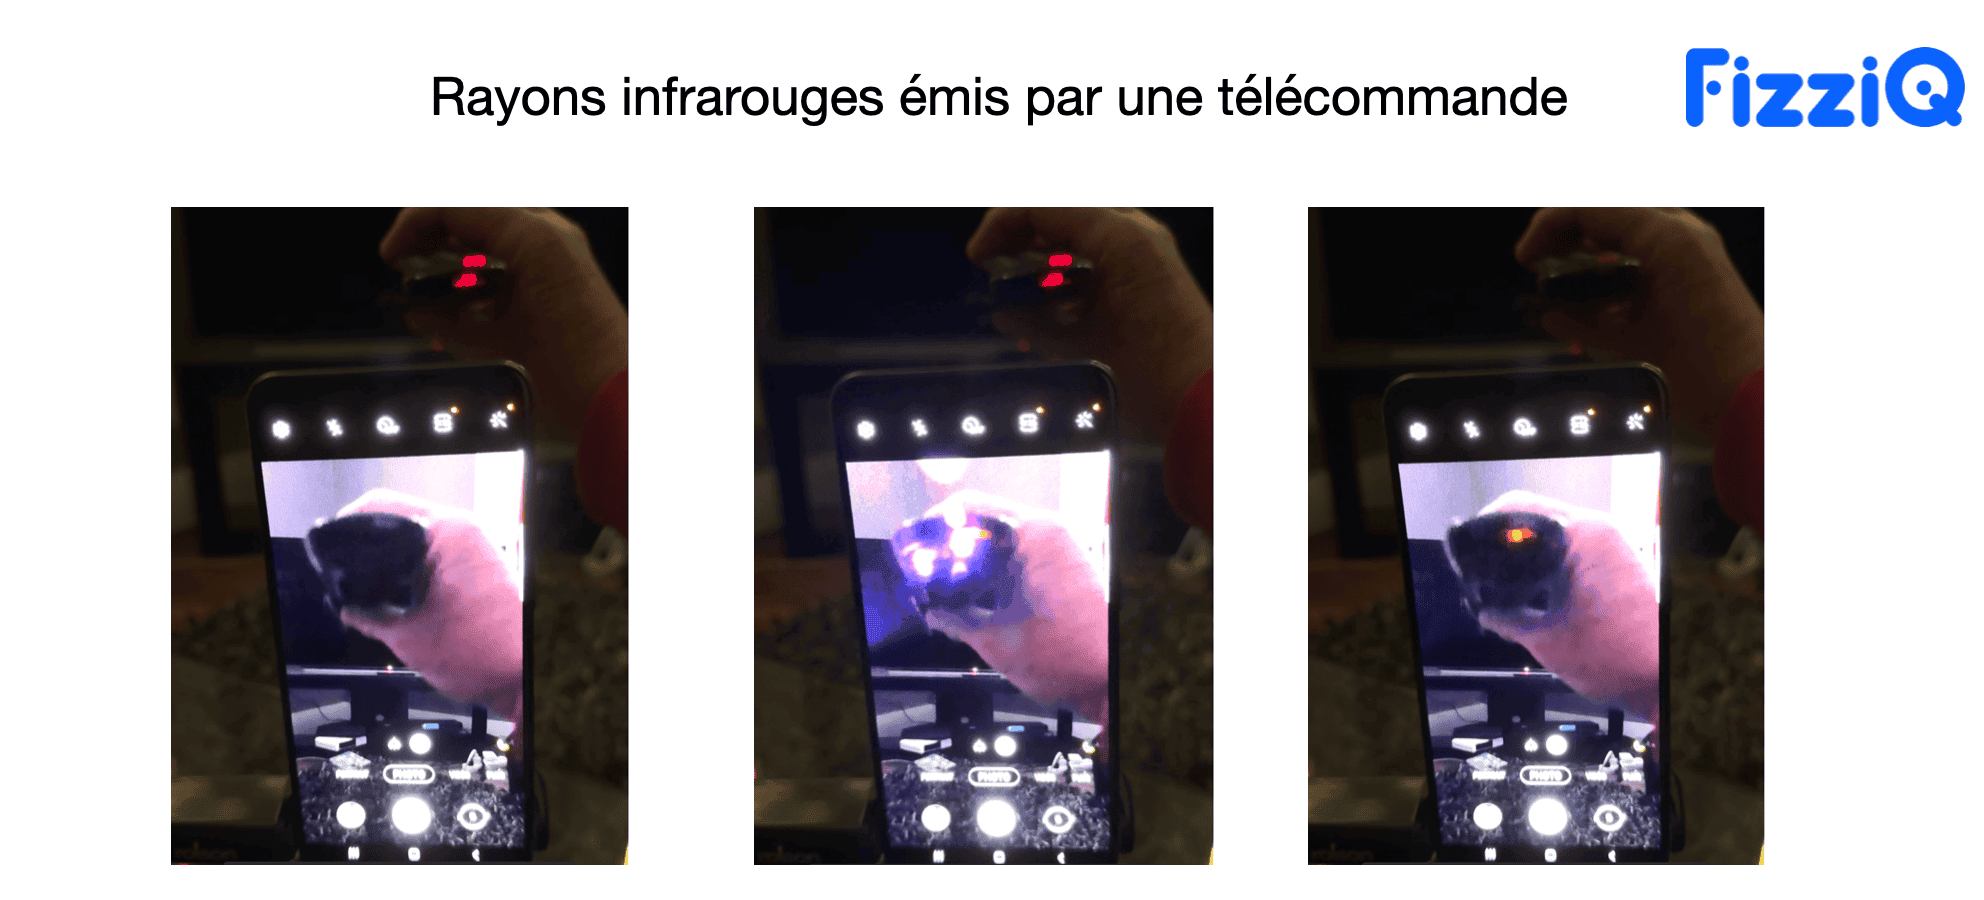
Why do remote controls use infrared rays rather than other types of radiation? Several reasons explain this choice: technological simplicity and reduced cost, but also specific characteristics of infrared rays. They are invisible to the naked eye, harmless to health, have limited range, and are sufficiently directional to allow precise control of devices without interfering with other nearby electronic devices.
Conduction and Absorption
One of the fundamental advances in climate change theory is the discovery of the interaction between certain gases, called greenhouse gases, and infrared rays[14]. We will see in other experiments how to demonstrate this phenomenon, but to understand it, it is simpler to experiment with solid surfaces. Indeed, while some materials like glass or plexiglass block infrared rays (or rather absorb them), others like transparent low-density polyethylene (LDPE) allow infrared rays to pass through. Some materials even allow infrared rays to pass while blocking visible radiation.
To highlight these transparency concepts, we can perform the following experiment with a thermopile or digital infrared thermometer[5]. A cup is filled with hot water and a surface is placed between the thermopile (MLX90614 circuit) and the infrared radiation source. We choose three different materials: a glass plate, a transparent packaging bag, and a garbage bag. The results in our experiment are as follows: without material: 23.9 degrees, with glass: 18 degrees, with transparent plastic: 23.2 degrees, and with the garbage bag: 21.8 degrees. The polypropylene of the food film therefore allows 90% of infrared rays to pass through, while the colored garbage bag allows only 65% and glass is opaque.
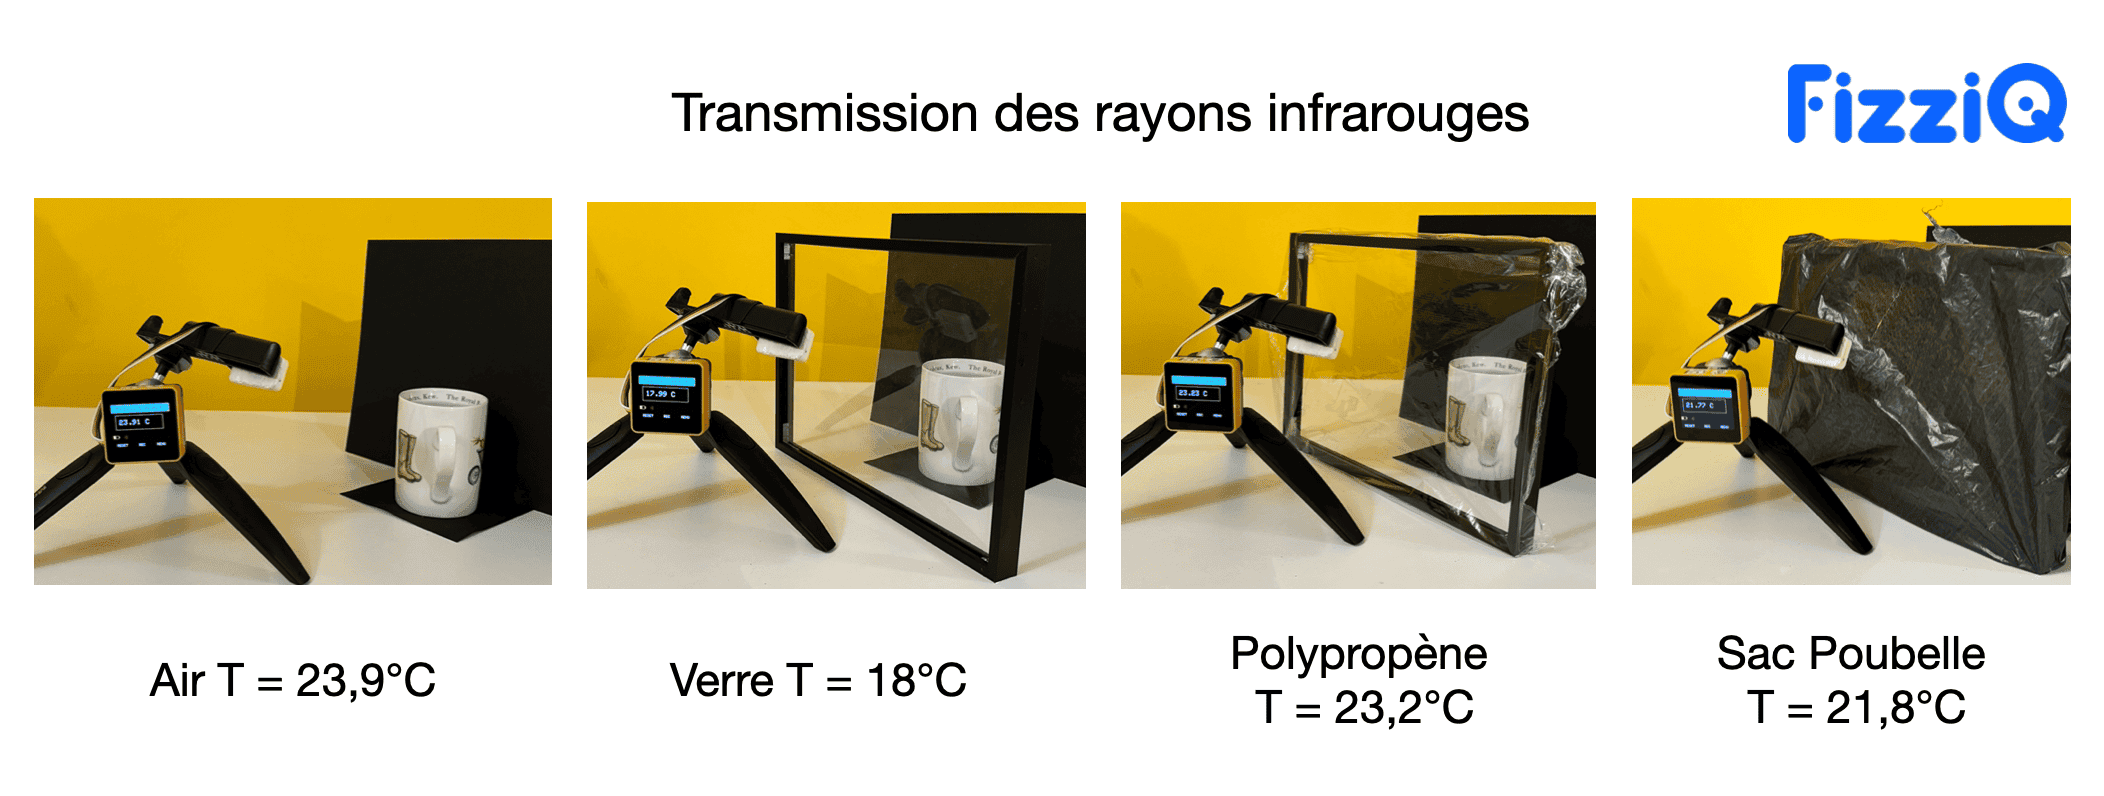
This experiment helps understand how the atmosphere allows visible rays to pass through but blocks ultraviolet rays, dangerous to humans, and certain frequencies of infrared rays.
Black Body Radiation
Earth’s atmosphere allows visible rays (and certain infrared rays) to pass through, which are then absorbed by Earth’s surface. The surface then re-emits infrared radiation, according to the black body principle. A black body is a theoretical object in physics that perfectly absorbs all incident electromagnetic radiation, without reflecting or transmitting any. It emits electromagnetic radiation called black body radiation, which depends only on its temperature and not on its composition. This radiation follows Planck’s law, describing the spectral distribution of emitted energy.
At temperatures below 500 degrees Celsius, a black body emits infrared rays invisible to the naked eye. However, as temperature increases, the amount of radiation emitted in the visible spectrum also increases, making the black body visible. Wien’s law allows us to determine the wavelength at which radiation is maximum.
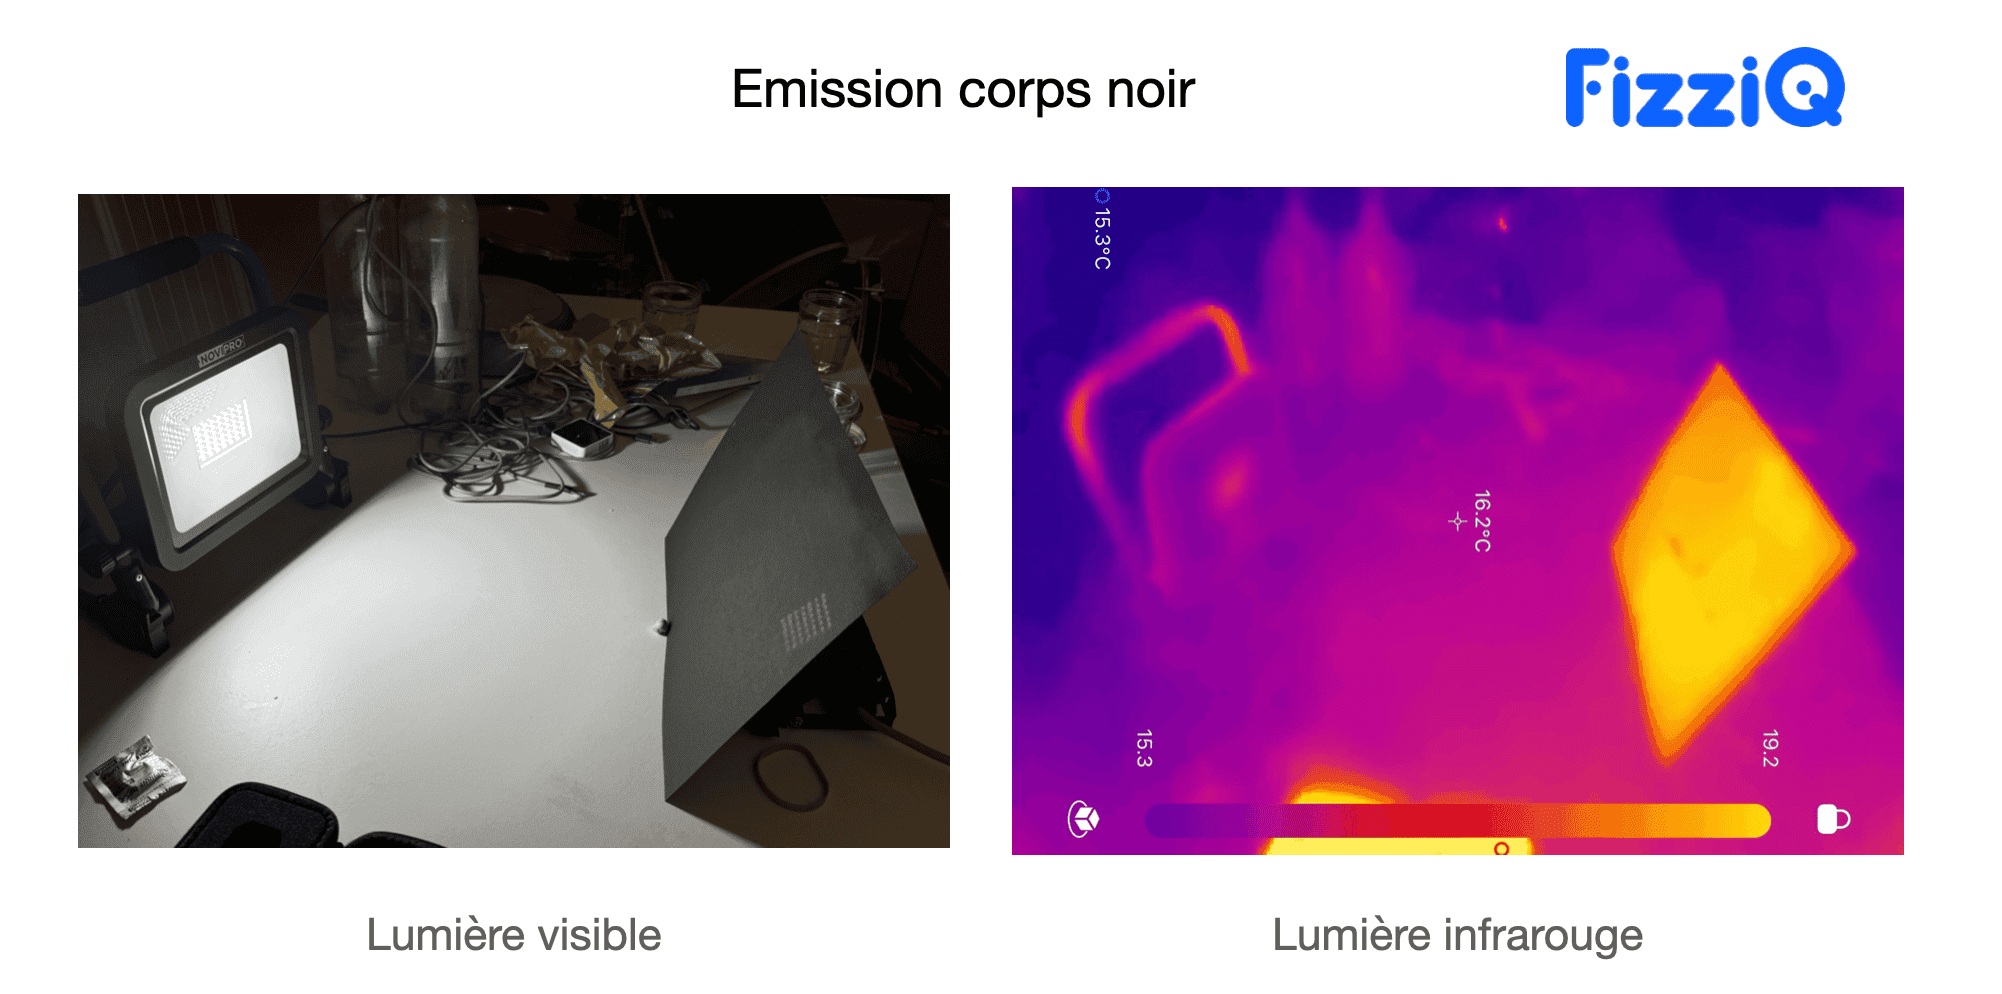
To visualize the black body effect, one can illuminate black cardboard with an LED lamp and measure the temperature of the cardboard and lamp with a thermopile (or infrared temperature detector). One notes that the lamp temperature is slightly higher than the atmosphere. Indeed, LED lamps produce very little heat and are therefore very efficient. However, the black cardboard temperature is higher than the lamp’s because the cardboard has absorbed all visible rays and re-emits infrared rays.
Albedo
A black body absorbs all radiation, but in reality, only part is absorbed by physical bodies. This ability to reflect incident light is albedo. Used mainly in astronomy and climatology, albedo ranges between 0 and 1, where 0 means the surface absorbs all light and 1 means it reflects it entirely. A material with high albedo, like snow or ice, reflects most light, thus contributing to local cooling. Conversely, a surface with low albedo, like the ocean or an asphalt road, reflects less light and absorbs a portion. This absorbed fraction of light is converted to heat, thus increasing the surface temperature. This is why the IPCC (Intergovernmental Panel on Climate Change) states that “painting roofs white would save 1Gt/year of greenhouse gas emissions, equivalent to 250 million vehicles.” A very ancient solution since the Egyptians painted their buildings white in antiquity to reflect the sun’s heat, and Romans used marble and other reflective materials in building structures.
To understand the effect of albedo on temperature, gather a powerful lamp (60W), thermometers or connected sensors, and materials of different colors (yellow, red, orange modeling clay, and gray and black aluminum bottles filled with water). Place the materials under the lamp keeping the same distance, angle, and orientation. Turn on the lamp for 10 minutes. Use the FizziQ app to measure luminance, a measure of reflected light, and calculate albedo as the ratio of a surface’s luminance to a white sheet of paper. After exposure, measure temperatures and observe that dark materials (red, black) absorb more light and heat up more than light materials (yellow, gray), thus demonstrating the impact of albedo on temperature. This experiment is described in detail on our partner’s website La main a la pate at this link.
From the above, one can estimate Earth’s albedo. By proposing a distribution of surfaces of different colors on the globe, one can get an idea of Earth’s albedo. This value can be compared to the estimate of 0.3 generally used to estimate what the globe’s temperature would be in the absence of greenhouse effect, namely -18 degrees.
Identifying Greenhouse Gases
In 1856, experimenter Eunice Foote published in the annals of the American Association for the Advancement of Science a paper in which she compared the relative warming of jars filled with air, CO2, and water vapor. She found that jars filled with CO2 and water vapor heated up faster and concluded with a prophetic sentence: “An atmosphere filled with this gas (CO2) would give our Earth a higher temperature”[13].
Today we know that the experiment as she performed it cannot explain the “climatic” greenhouse effect, and is mainly explained by differences in density between air and CO2, and by conduction and convection effects in glass jars that absorb infrared rays. However, this pioneer’s intuition was correct, and CO2 is identified as a greenhouse gas, i.e., a gas that absorbs certain infrared rays and re-diffuses them.
Many other experiments found online also claim to demonstrate the effect of CO2 as a greenhouse gas. Many of these experiments are not reproducible or give false results. In these experiments, the effects of convection and conduction are not evaluated even though they are dominant compared to the radiative effect due to infrared ray absorption for greenhouse gases[2][7][10].
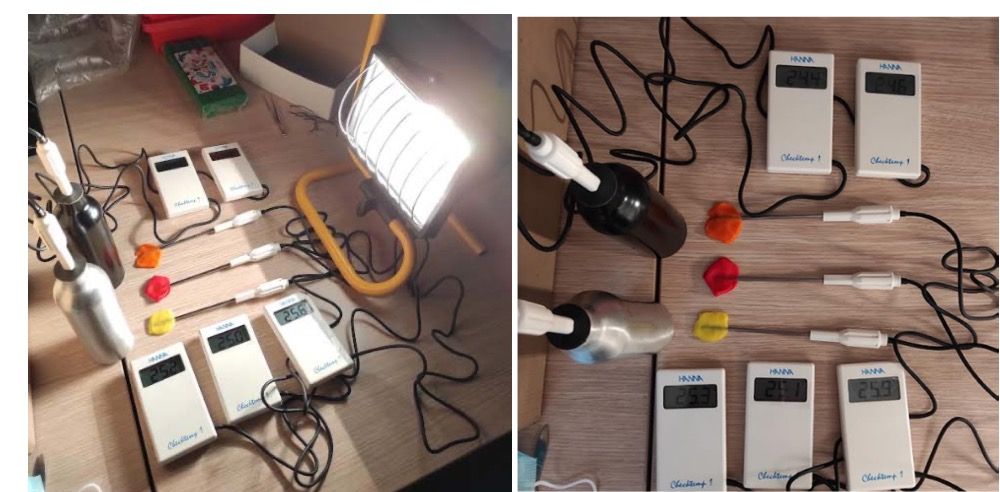
However, the following protocol gives quite interpretable results. It consists of comparing two gases with similar physical characteristics but where one is not a greenhouse gas. We will then have three measurements at our disposal, which will also allow us to evaluate the convective effect. A commonly used gas is argon, which is an inert gas with characteristics similar to carbon dioxide. The temperature differences due to the radiative effect are on the order of a few tenths of a degree, so measurement precision is very important.
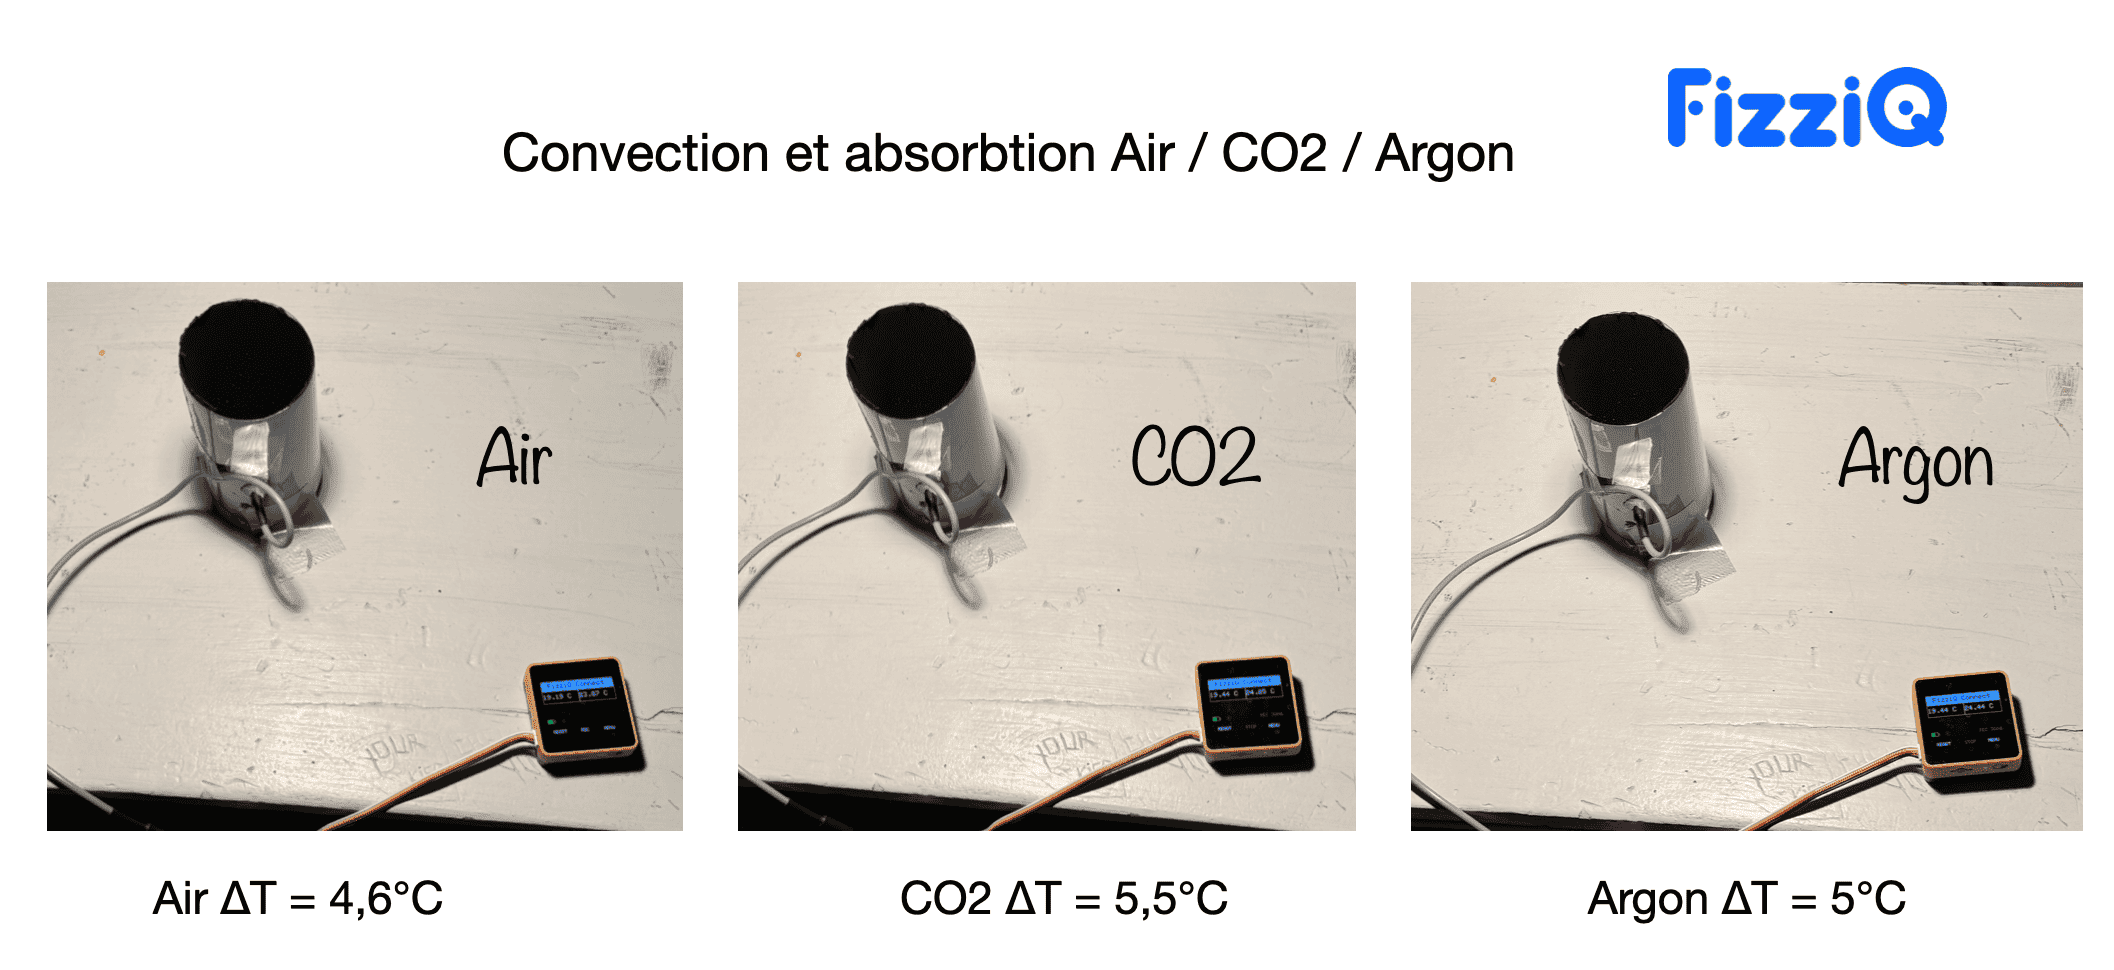
In the example in the photo above, we took a cut plastic bottle lined with black paper, illuminated by a 100W projector at a height of 60 cm. A probe is placed inside, protected by a piece of aluminum to avoid direct lamp radiation, and an external probe is placed at 1.5 m as a reference. At equilibrium, we measure the temperature difference ΔT between the internal probe and the reference. A radiative effect of 0.5°C and a convection effect of 0.4°C are observed.
CO2 Absorption Spectrum
The CO2 molecule absorbs infrared rays due to its vibration modes, notably asymmetric stretching and bending vibrations. When the molecule’s atoms vibrate in a way that changes the dipole moment, they can interact with infrared radiation. These vibrations allow the CO2 molecule to absorb and re-emit infrared energy. However, the CO2 molecule does not absorb all frequencies. As John Tyndall showed with the development of the first absorbance spectrum of different gases, CO2 has different absorption bands in the mid and far infrared (4 micrometers and 15 micrometers). Other atmospheric compounds like water vapor also contribute to climate change by absorbing other infrared ray frequencies, notably mid-infrared around 6.3 micrometers.
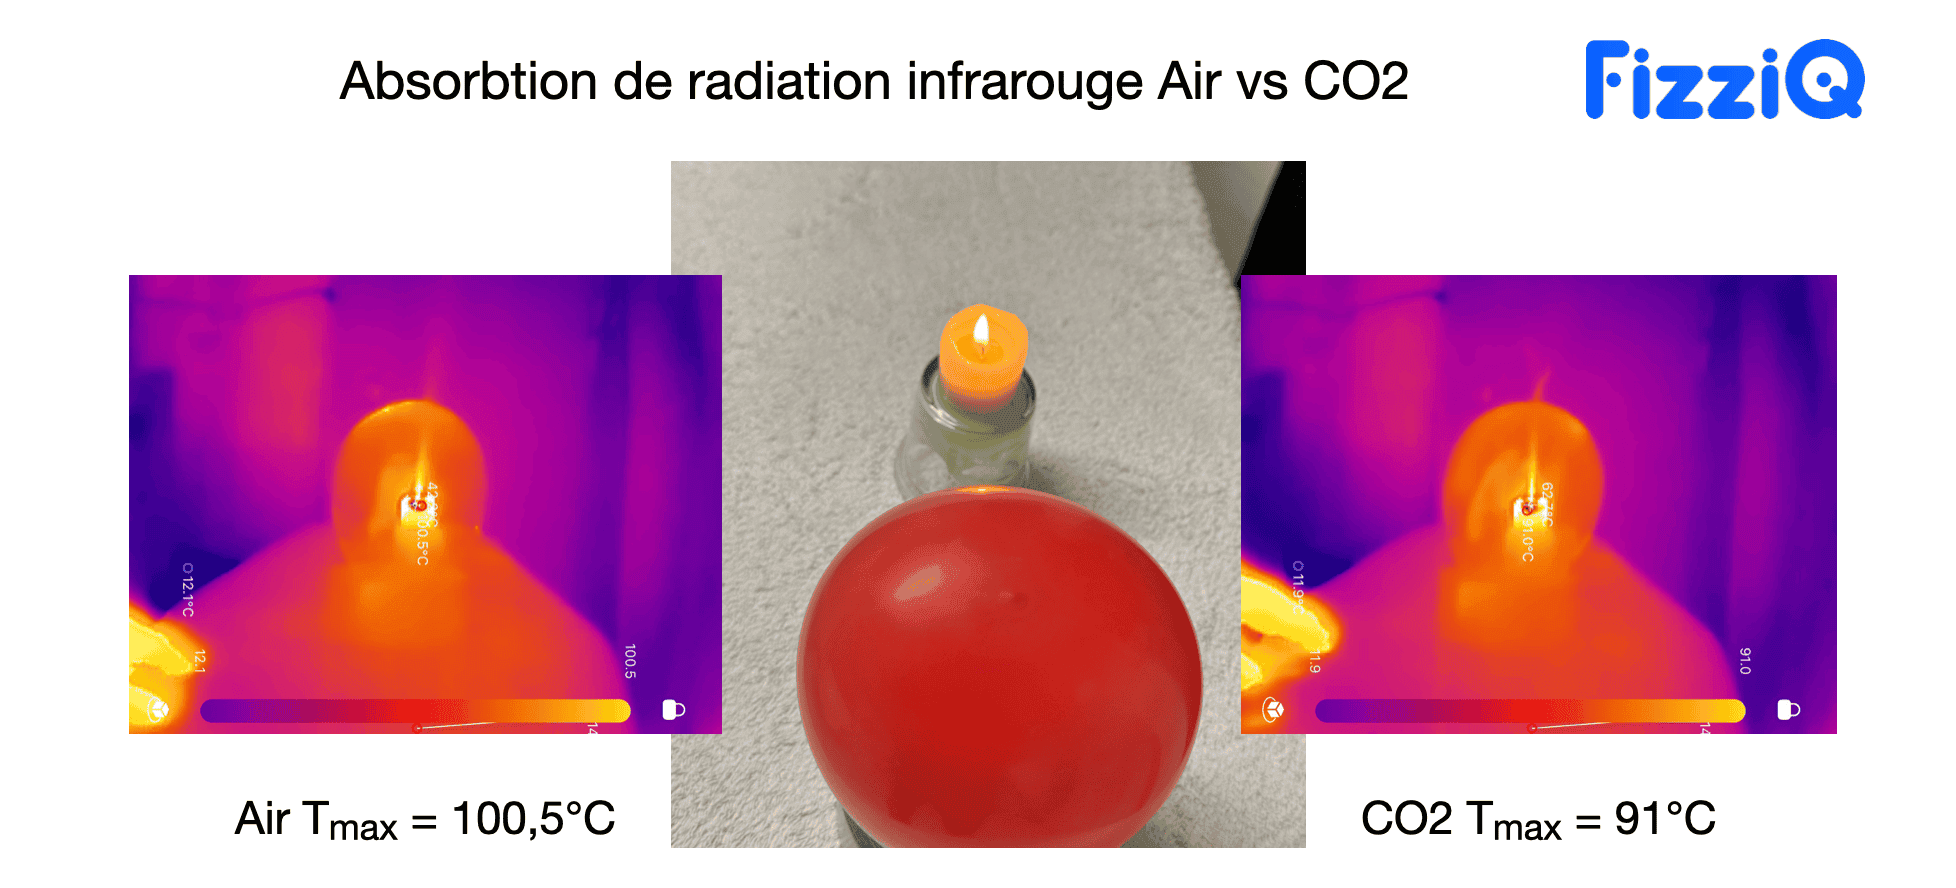
To visualize this absorption, the following experiment can be done[11]. Inflate a balloon with CO2 using baking soda and vinegar, and inflate another balloon with air. Then measure the temperature of a candle flame placed behind the balloon using an infrared camera. The maximum temperature of the flame decreases when using a balloon filled with CO2, due to the fact that infrared radiation is absorbed by the CO2 present in the balloon.
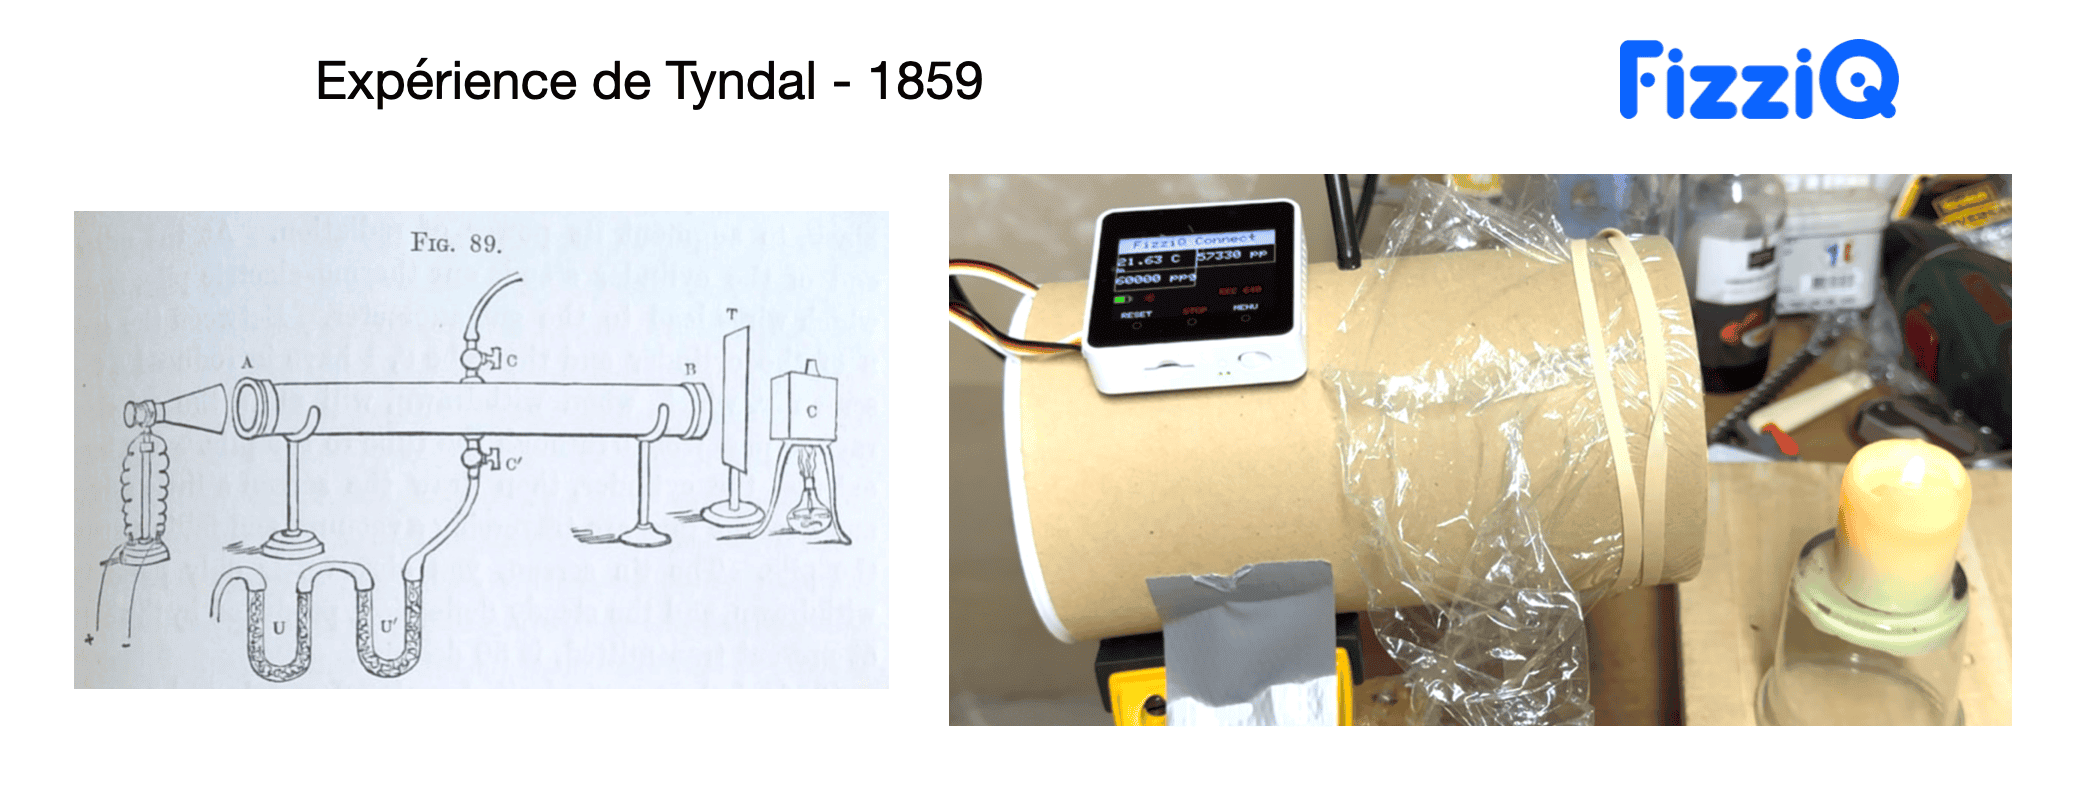
It is also possible to reproduce Tyndall’s experiment by building a chamber closed at one end with a thermopile inside. A candle is placed in front of this device to create infrared rays. Carbon dioxide or air from a balloon is introduced into this chamber. The impact of air and CO2 is compared. This precise apparatus allowing perfectly reproducible conditions is the ideal way to study the effect of infrared rays on CO2.
Stratospheric Cooling
One of the most compelling predictions of climate change modeling is stratospheric cooling.
The stratosphere is the second layer of Earth’s atmosphere, located above the troposphere and extending from 10 to 50 kilometers in altitude. It is characterized by a progressive increase in temperature with altitude, due to the absorption of ultraviolet (UV) rays by ozone. This layer is essential for protecting life on Earth, as it contains the ozone layer, which absorbs most harmful UV from the sun. Unlike the troposphere, the stratosphere is relatively stable, with little vertical air movement.
In 1967, scientists Syukuro Manabe and Richard Wetherald performed the first computer modeling of the impact of doubling CO2 concentration in the atmosphere. They calculated that the greenhouse effect would cause warming of the troposphere but also, more surprisingly, cooling of the stratosphere. Indeed, if there are more greenhouse gases in the stratosphere, it behaves like a black body and will emit more infrared radiation both toward space and toward Earth. But since less heat reaches the stratosphere because this heat is captured in the troposphere layers, this atmospheric layer cools because it emits more radiation than it receives.
This contrast between troposphere warming and stratosphere cooling is a clear signature of the impact of human activities on climate, and Manabe and Wetherald’s predictions have been confirmed by satellite and weather balloon measurements.
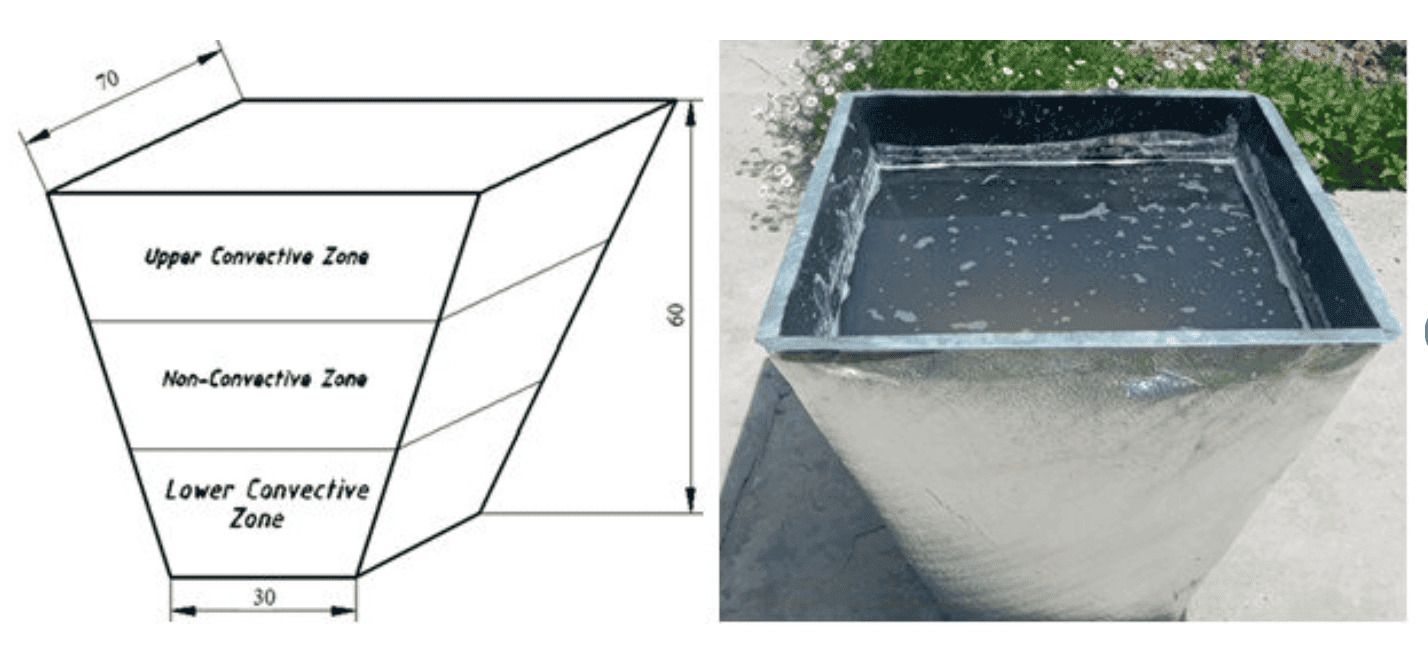
To experiment with this particular effect, we can use a solar pond. A solar pond, or solar basin, is a container filled with highly salty water placed in the sun. Water density increases with salinity because dissolved salts add mass to water without significantly increasing its volume. Layers in the water column naturally stratify according to their density, with denser (saltier) layers at the bottom and less dense (less salty or fresh) layers at the top. This stratification creates a stable situation where heavier layers stay at the bottom, preventing convection movements that could mix the layers.
In solar ponds, this stratification is exploited to create a stable thermal gradient. The upper layer, low in salt, acts as thermal insulation. The intermediate layer, with a salinity gradient, prevents convection movements, thus trapping heat. The lower layer, very salty and dense, absorbs and stores solar heat. This configuration allows the solar pond to effectively retain heat by preventing layer mixing and maximizing solar energy absorption and storage. This trapped heat can then be extracted using heat exchangers and used for various applications such as space heating, industrial processes, or electricity production. The solar pond captures and retains solar energy simply and efficiently, providing an effective method for thermal energy storage and use.
What we observe, which helps better understand the stratosphere cooling effect, is that if we increase the salt concentration at constant illumination, the water surface temperature decreases. Indeed, more energy is trapped at the bottom of the pool, and less energy is available to warm the pool’s surface.
Conclusion
Understanding and demonstrating the greenhouse effect, key to climate change, is a major experimental challenge. Although many experiments are available, few are faithfully reproducible. However, with inexpensive equipment, it is possible to perform quite realistic experiments that show different aspects of the greenhouse effect phenomenon[11][12]. Combined approaches and analogies allow grasping essential aspects of climate change, highlighting the importance of rigorous and varied scientific teaching.
Learn More
[1] http://climatechangeeducation.org/hands-on/difficulties/heating_greenhouse_gases/sound_examples/
[2] https://rtobin.phy.tufts.edu/Wagoner%20AJP%202010.pdf
[3] https://planet-terre.ens-lyon.fr/ressource/critique-tp-co2atm.xml
[4] https://protonsforbreakfast.wordpress.com/2023/09/04/tyndall-1/
[5] https://planet-terre.ens-lyon.fr/ressource/rayonnement-effet-de-serre.xml
[6] https://web.lmd.jussieu.fr/~jldufres/publi/1996/Manip_Billet_1996/Scan/p_dossier_3.pdf
[7] https://iopscience.iop.org/article/10.1088/0143-0807/35/2/025016
[8] https://culturesciencesphysique.ens-lyon.fr/ressource/Effet-serre-Dufresne.xml
[9] https://web.lmd.jussieu.fr/~jldufres/publi/1996/Manip_Billet_1996/Scan/p_dossier_3.pdf
[10] http://hharde.de/index_htm_files/Harde-Schnell-GHE-m.pdf
[11] https://www.sentinel-hub.com/docs/student_exploration_with_infrared_light.pdf
[13] https://royalsocietypublishing.org/doi/10.1098/rsnr.2020.0031
[14] https://jancovici.com/changement-climatique/aspects-physiques/quest-ce-que-leffet-de-serre/
[15] https://climate-dynamics.org/wp-content/uploads/2016/06/manabe67.pdf