
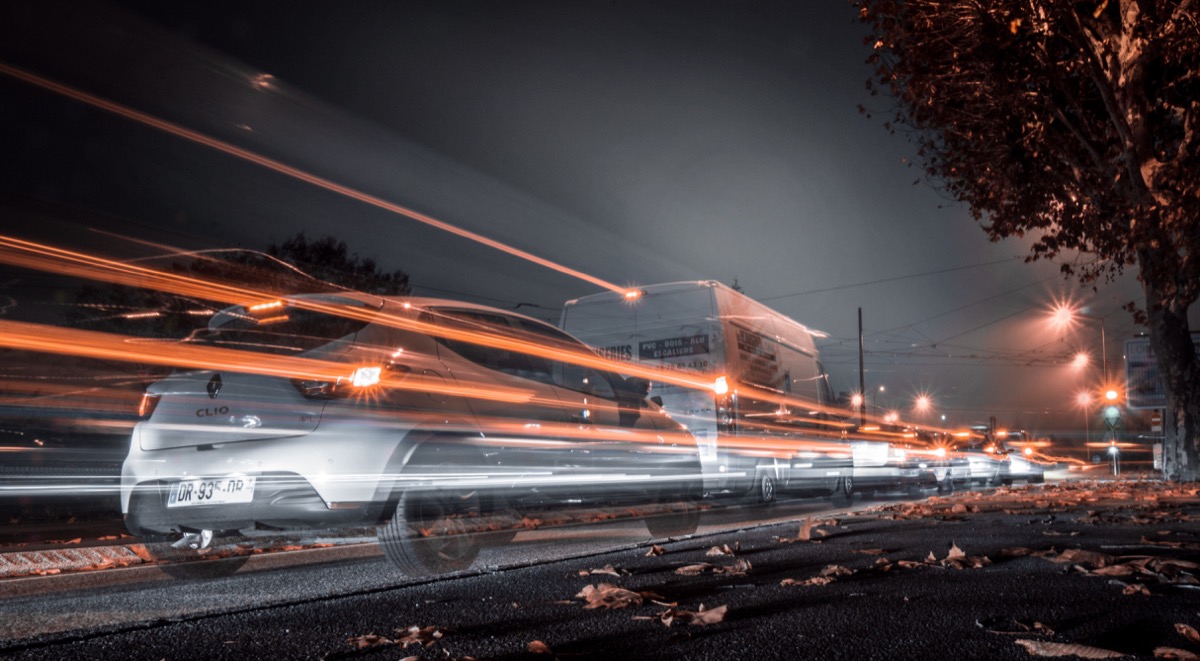
Doppler effect of a vehicle
This activity allows students to understand the Doppler effect and use it to calculate the speed of a moving vehicle. It demonstrates how an acoustic phenomenon can serve as a measurement tool.
Activity Summary
The student analyzes the sound recording of a moving vehicle using FizziQ spectral tools to detect the change in frequency caused by the Doppler effect. By comparing the sound spectra before and after the vehicle passes, the student calculates the shift in percentage and then uses the Doppler effect formula to determine the approximate speed of the vehicle.
Introduction
You have likely noticed that the pitch of an ambulance siren drops noticeably as it passes you. This familiar experience is the Doppler effect, named after Austrian physicist Christian Doppler, who first described it mathematically in 1842. Doppler predicted that the observed frequency of a wave changes when the source and observer are in relative motion, an idea that was initially met with skepticism. It was confirmed experimentally in 1845 by Buys Ballot, who famously hired a group of trumpeters to play on an open train car while musicians with perfect pitch stood at the station. Today, the Doppler effect is indispensable in medicine (Doppler ultrasound for measuring blood flow), astronomy (determining whether galaxies are moving toward or away from us), and law enforcement (radar speed guns). In this experiment, students use FizziQ's spectral analysis tools to analyze a recording of a passing vehicle, measure the frequency shift, and calculate the vehicle's speed directly from the Doppler equation.
Learning Objectives
- Measure the apparent frequency shift caused by the Doppler effect
- Apply the Doppler equation to calculate the speed of the vehicle from the frequency shift
- Understand the physical mechanism behind the compression and stretching of sound waves
- Connect the Doppler effect to real-world applications in medicine, astronomy, and radar technology
Scientific Concepts
Instruments and sensors
Scientific instruments
- Sound spectrum analyzer (FFT)
Sensors
- Microphone
FizziQ Features
- Sound library — Provides the pre-recorded 'Doppler Effect' vehicle pass-by sound for analysis when no personal recording is available
- Experiment notebook — Used to log the measured approach and recession frequencies and the calculated vehicle speed
Required Materials
- - Smartphone with the FizziQ application - "Doppler Effect" recording from the FizziQ sound library, or a personal recording of a moving vehicle - FizziQ experiment notebook (to log measured frequencies and results) - Note: the protocol remains adaptable to any comparable spectral/audio analysis tool.
Experimental Protocol
Open FizziQ and navigate to the **Sound Library**. Load the **'Doppler Effect'** recording, which contains the sound of a vehicle passing the microphone.
Listen to the recording first. Notice the distinct change in pitch as the vehicle approaches and then recedes.
Open the **Spectrum Analyzer** (FFT) tool in FizziQ. Play the recording and pause during the **approach phase** (before the vehicle passes).
Identify the **dominant frequency peak** in the spectrum during the approach. Record this value as **f_approach**.
Resume playback and pause during the **recession phase** (after the vehicle has passed). Identify and record the dominant frequency as **f_recede**.
Calculate the **frequency shift**: Δf = f_approach - f_recede.
Calculate the **percentage shift**: Δf / f₀ × 100, where f₀ = (f_approach + f_recede) / 2 is the estimated emitted frequency.
Apply the Doppler formula to calculate the vehicle speed: **v = c × (f_approach - f_recede) / (f_approach + f_recede)**, where c = 343 m/s is the speed of sound.
Convert the calculated speed to **km/h** by multiplying by 3.6.
Repeat the frequency measurement at several points during the approach and recession phases to verify that the frequency remains approximately constant during each phase.
If available, record your own Doppler effect audio by standing safely near a road and capturing the sound of a passing vehicle. Analyze it using the same method.
Discuss the assumptions made (straight-line motion, constant speed, observer perpendicular to the trajectory at the moment of passage) and how violations would affect the results.
Printable version: lab handout (PDF) with the protocol, materials and questions, for students without a screen in front of them.
Also possible with other apps: Phyphox users know this measurement as the "Doppler effect" experiment. The protocol above works with any app that offers the same instrument; FizziQ adds the experiment notebook to record, plot and export the results, and the QR code to share the protocol with a class. See FizziQ for Phyphox users.
Expected Results
For a typical vehicle traveling at 50 km/h (13.9 m/s), the frequency shift between approach and recession phases should be approximately 8% (4% higher during approach, 4% lower during recession). For example, if the engine's dominant tone is around 200 Hz, the approach frequency would be about 208 Hz and the recession frequency about 192 Hz. The calculated speed should be within 10-20% of the actual vehicle speed, with discrepancies arising from the fact that the vehicle may not be moving in a straight line directly toward and away from the microphone, the speed may not be perfectly constant, and the dominant frequency may be difficult to identify precisely in a complex engine sound spectrum. Students should observe that the frequency transition occurs rapidly at the moment of closest approach.
Scientific Questions
- What would happen to the perceived frequency if the observer were moving toward a stationary source?
- How is the Doppler effect used in medical ultrasound to measure blood flow velocity?
- What is the cosmological redshift, and how is it related to the Doppler effect?
- Why does the frequency change happen most rapidly at the moment of closest approach?
- What would the Doppler effect sound like if the vehicle were traveling at half the speed of sound?
Scientific Background
The Doppler effect is the apparent variation in frequency of a wave perceived by an observer when the source of the wave and the observer are in relative motion. For a sound source approaching the observer, the perceived frequency is higher than the emitted frequency (higher sound); when it moves away, the perceived frequency is lower (deeper sound).
This variation is explained by the compression or stretching of sound waves. Mathematically, for a moving source and a fixed observer, the relationship is: f' = f × (c/(c-v)), where f' is the perceived frequency, f the emitted frequency, c the speed of sound (approximately 343 m/s at 20°C) and v the speed of the source.
From this formula, we can isolate v: v = c × (1-f/f'). Analysis with FizziQ uses the frequency spectrum to precisely measure pre- and post-pass frequencies.
The frequency shift Δf/f is proportional to the v/c ratio for low speeds. For example, an offset of 3% corresponds to a speed of approximately 10 m/s (36 km/h).
The amplitude of the signal can also help determine the precise moment the vehicle passes the observer. This technique is used by Doppler radars to measure vehicle speed, but with electromagnetic waves rather than sound.
Extensions
- Investigate how the angle between the vehicle's trajectory and the observer affects the perceived frequency change
- Use two smartphones: one in a moving vehicle emitting a pure tone, and one stationary recording the Doppler-shifted sound
- Compare the Doppler shift for sounds of different frequencies emitted by the same moving source
- Calculate the speed of an emergency vehicle from its siren recording and compare with the posted speed limit
Frequently Asked Questions
I cannot identify a clear dominant frequency in the vehicle sound spectrum. What should I do?
Vehicle sounds are complex mixtures of engine, tire, and wind noise. Look for the strongest peak in the spectrum, often in the 100-500 Hz range for engine harmonics. Using a recording of a vehicle with a loud, tonal engine note (motorcycle, sports car) gives clearer results.
My calculated speed is much higher or lower than expected. What could be wrong?
Verify that you are measuring the same harmonic frequency in both the approach and recession spectra. Also check that you are using the correct formula and units. The formula v = c × (f_a - f_r)/(f_a + f_r) gives speed in m/s.
Why not use a pure tone from a smartphone instead of a vehicle?
You can. Having someone carry a smartphone emitting a pure tone while walking or cycling past gives a cleaner Doppler signal. However, the frequency shift is smaller at walking or cycling speeds.
Can I observe the Doppler effect with light instead of sound?
Yes, the Doppler effect applies to all waves, including light. The cosmological redshift of distant galaxies is a Doppler effect for light, indicating that those galaxies are moving away from us. However, light Doppler shifts are too small to detect with consumer equipment.
Detailed Description
The student analyzes the sound recording of a moving vehicle using FizziQ spectral tools to detect the change in frequency caused by the Doppler effect. By comparing the sound spectra before and after the vehicle passes, the student calculates the shift in percentage and then uses the Doppler effect formula to determine the approximate speed of the vehicle. FizziQ's spectrum analyzer (FFT) is used to measure the dominant frequency during the approach and recession phases, with the experiment notebook available to record and compare these values.
This activity is part of our sound resources. To dig deeper into measuring and analyzing sound (waveform, spectrum, spectrogram, decibels) and find all twelve experiments, read our complete guide to measuring and analyzing sound with a smartphone or computer.
Ready to start?
Download FizziQ and try this activity with your students.