
Barometric altimetry
This experiment allows students to understand the relationship between atmospheric pressure and altitude. It develops the ability to establish mathematical models from experimental data.
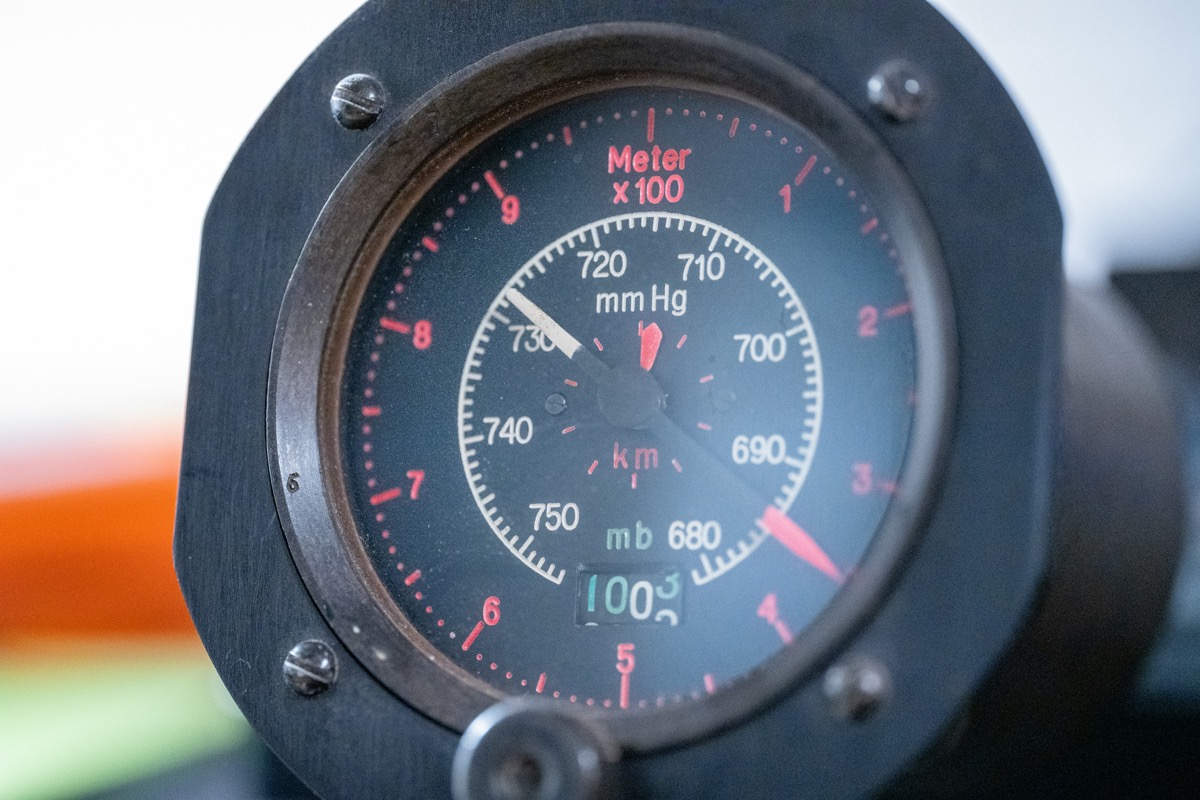
Activity Summary
The student uses the FizziQ atmospheric pressure sensor to take measurements at different heights, such as the floors of a building or on a hill. For each level, it records the pressure and estimated altitude, then analyzes the relationship between these values to determine how pressure decreases with altitude. From this data, the student develops a formula to calculate altitude from pressure.
Introduction
Evangelista Torricelli, Blaise Pascal, and the early barometric scientists of the 17th century discovered that atmospheric pressure decreases with altitude, a principle that remains central to aviation and meteorology today. Every commercial aircraft uses barometric altimeters to determine its flight altitude by measuring the surrounding air pressure. The same principle is at work in modern smartphones, which contain precision barometric sensors originally included to improve GPS accuracy in urban environments. These tiny sensors can detect pressure changes equivalent to less than one meter of altitude difference. By climbing a staircase or a hillside with a smartphone, students can directly observe the relationship between pressure and altitude and develop a mathematical model from their own data. This experiment bridges historical physics, atmospheric science, and modern sensor technology, providing a concrete example of how a physical law translates into a practical measuring instrument.
Learning Objectives
- Establish the relationship between pressure change and altitude difference
- Develop a simplified barometric formula from experimental data
- Calculate altitude from pressure measurements and evaluate accuracy
- Understand the physical reasons for the decrease of atmospheric pressure with altitude
Scientific Concepts
Instruments and sensors
Scientific instruments
- Atmospheric pressure meter
Sensors
- Barometer
FizziQ Features
- Experiment notebook — Used to record the pressure reading at each floor and plot the pressure-difference-versus-altitude graph.
Required Materials
- - Smartphone with the FizziQ app (iOS or Android built-in barometer
- an external sensor can be paired if the device has none) - Access to a multi-storey building with at least 4 accessible floors, or a hill - Tape measure or known floor-height reference - FizziQ experiment notebook for recording pressure and altitude data - Note: the protocol remains adaptable to any comparable pressure-measurement tool.
Experimental Protocol
Open the FizziQ application and select the **Atmospheric Pressure** sensor. Verify that it displays a value close to **1013 hPa** (may vary with weather conditions and local altitude).
Choose a building with at least **4 accessible floors** (ideally more). If possible, determine the height of each floor (typically 3 to 3.5 meters between floors).
Stand on the **ground floor** and record the pressure reading. Note it as your reference measurement (P₀). Wait at least 10 seconds for the sensor to stabilize.
Walk up to the **first floor** and wait 15 seconds for the pressure to stabilize. Record the new pressure value.
Repeat this measurement on each successive floor, always waiting for stabilization before recording.
For each floor, calculate the **pressure difference** ΔP = P₀ - P relative to the ground floor.
If you know the height of each floor, plot a graph of **pressure difference versus altitude** in your FizziQ notebook.
From your graph, determine the approximate **rate of pressure change per meter of altitude** (should be around 0.12 hPa/m or equivalently about 1 hPa per 8.5 m).
Use your data to derive a simplified formula: **Δh ≈ (P₀ - P) × 8.5** where Δh is in meters and pressures are in hPa.
Test your formula by predicting the pressure at a known altitude (e.g., the top of a nearby hill) and comparing with the measured value.
Investigate the effect of **opening and closing doors** or **turning on heating/ventilation** on the pressure reading.
Printable version: lab handout (PDF) with the protocol, materials and questions, for students without a screen in front of them.
Also possible with other apps: Phyphox users know this measurement as the "Pressure" experiment. The protocol above works with any app that offers the same instrument; FizziQ adds the experiment notebook to record, plot and export the results, and the QR code to share the protocol with a class. See FizziQ for Phyphox users.
Expected Results
Students should observe a consistent decrease in atmospheric pressure of approximately 0.10-0.12 hPa per meter of altitude gain. For a typical building with 3-meter floors, the pressure drop between consecutive floors should be about 0.3-0.4 hPa. The graph of pressure difference versus altitude should be approximately linear over the range of a few floors (up to about 30-50 meters). The derived conversion factor should be close to 8.5 m/hPa. Measurement precision with a smartphone barometer is typically ±0.1 hPa, corresponding to approximately ±1 meter of altitude uncertainty. Students may notice small pressure fluctuations due to wind, opening doors, or HVAC systems, which can introduce errors of 0.1-0.3 hPa.
Scientific Questions
- Is the relationship between pressure and altitude perfectly linear? Why or why not?
- What factors other than altitude could cause the barometer reading to change?
- How do weather changes affect the accuracy of a barometric altimeter?
- Why do aircraft altimeters need to be regularly recalibrated during flight?
- Could you use this technique to measure the height of a mountain? What limitations would you encounter?
Scientific Background
Atmospheric pressure decreases with altitude in an approximately exponential relationship. At sea level, the standard pressure is about 1013.25 hPa, but it decreases by about 1 hPa every 8.5 meters at low altitudes.
This relationship is not perfectly linear over large variations in altitude, because air is compressible and its density also decreases with altitude. For small altitude variations (a few hundred meters), we can use the simplified barometric approximation: Δh ≈ (P₀ - P) × 8.5, where Δh is the altitude difference (in meters), P₀ the pressure at the reference point and P the pressure at the measurement point (in hPa).
For more precise calculations over large amplitudes, the complete barometric formula takes temperature into account. Modern smartphones incorporate precision barometers (±0.1 hPa, equivalent to approximately ±1 meter of altitude) to improve GPS positioning and other functions.
Extensions
- Investigate how weather changes over a full day affect the baseline pressure reading
- Take measurements on a hillside or mountain path and compare the pressure-altitude relationship over a larger altitude range
- Study the effect of rapid elevator rides on the barometer reading
- Compare the barometric sensitivity of different smartphone models to evaluate sensor precision
Frequently Asked Questions
The pressure reading fluctuates constantly. How do I get a stable measurement?
Wait at least 15 seconds after reaching each floor for the sensor to stabilize. Avoid taking measurements near open windows, doors, or HVAC vents, as air currents can cause temporary pressure fluctuations. Take the average of several readings over 10 seconds.
My measurements do not show a consistent pressure decrease between floors. What could be the cause?
Ensure you are waiting long enough for stabilization. Check that doors to stairwells are closed, as pressure differences between areas of a building can be affected by ventilation systems. Very windy conditions can also create pressure variations.
The calculated altitude does not match the known building height. Why?
The simplified formula Δh ≈ (P₀ - P) × 8.5 is an approximation valid for small altitude changes near sea level at standard temperature. Temperature variations, weather changes between measurements, and sensor calibration differences can introduce errors of several percent.
Does this work on all smartphones?
Most modern smartphones contain a barometric pressure sensor, but some budget models may not. iPhones from iPhone 6 onward and most Android phones from 2014 onward include this sensor. FizziQ will indicate if the sensor is unavailable.
Detailed Description
The student uses the FizziQ atmospheric pressure sensor to take measurements at different heights, such as the floors of a building or on a hill. For each level, it records the pressure and estimated altitude, then analyzes the relationship between these values to determine how pressure decreases with altitude. From this data, the student develops a formula to calculate altitude from pressure. In practice, the FizziQ app reads the smartphone's built-in barometer in real time and lets students log each pressure value directly in the experiment notebook to build their pressure-versus-altitude graph.
Ready to start?
Download FizziQ and try this activity with your students.