
Adding sound levels in decibels
This experiment allows us to discover that the addition of two identical sound sources does not lead to a doubling of the perceived intensity but to a lower gain. It introduces the notion of logarithmic decibel scale.
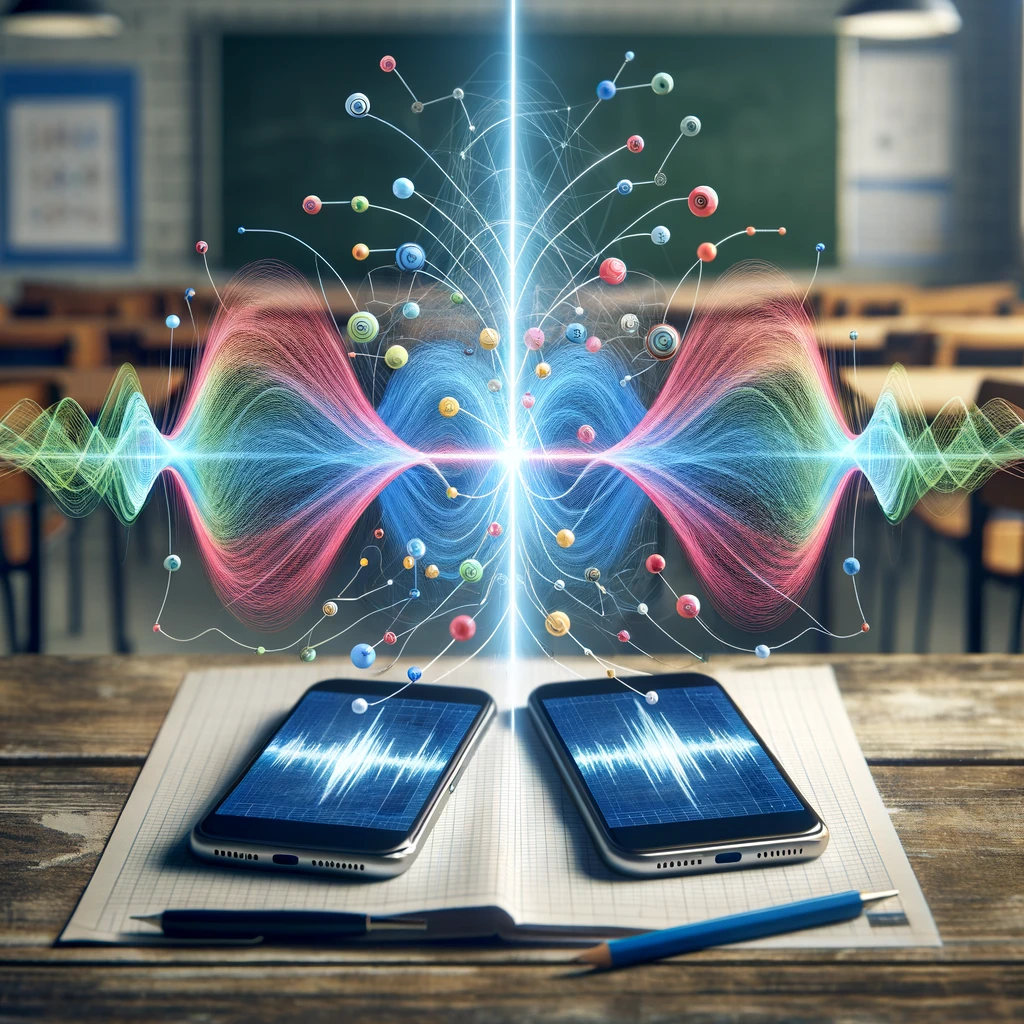
Activity Summary
The student uses three smartphones: one to measure the sound level and two others to emit white noise. After calibrating each transmitter smartphone to 60 dB, the student measures the sound level when the two sources transmit simultaneously. The experiment is repeated with different types of sounds to analyze whether the sound increase remains constant and to understand the differences observed.
Introduction
If one loudspeaker produces sound at 60 decibels, how loud are two identical loudspeakers playing together? Most people intuitively answer 120 decibels, doubling the perceived loudness. The actual answer, approximately 63 decibels, reveals a fundamental and often counterintuitive aspect of acoustics: the decibel scale is logarithmic, not linear. This mathematical property reflects how our ears perceive sound intensity, compressing an enormous dynamic range into a manageable scale. The human ear can detect sounds ranging from a whisper at about 20 dB to a jet engine at 140 dB, a ratio of sound intensities spanning 10 billion to one. Understanding the logarithmic nature of decibels is essential in audio engineering, environmental noise assessment, and architectural acoustics. This experiment provides students with hands-on experience of this principle by measuring the combined sound level of two independent noise sources and discovering that doubling the number of sources produces only a modest 3 dB increase.
Learning Objectives
- Discover that combining two identical sound sources produces an increase of approximately 3 dB, not a doubling
- Understand the logarithmic nature of the decibel scale
- Investigate whether the type of sound (pure tone vs. white noise) affects the result
- Apply the formula L = 10 × log(I/I₀) to predict the combined sound level
Scientific Concepts
Instruments and sensors
Scientific instruments
- Sound level meter (dB)
- Synthesizer (white noise and pure tone generator)
Sensors
- Microphone
FizziQ Features
- Experiment notebook — Used to record the sound level readings for each trial (single source, combined sources, different frequencies) and to calculate the theoretical prediction L_total = L1 + 10 x log(2).
Required Materials
- - Three smartphones with the FizziQ app installed (one set up as sound level meter, the other two as sound emitters) - A quiet space with minimal echo - A tape measure to fix and check distances between the phones - Note: the protocol remains adaptable to any comparable sound level measurement tool.
Experimental Protocol
Open FizziQ on three smartphones. Designate one as the **measuring device** and the other two as **emitters**.
On the measuring smartphone, open the **Sound Level (dB)** sensor and verify it reads the ambient noise level (ideally below 40 dB).
On emitter smartphone 1, use the FizziQ synthesizer to produce **white noise** at a moderate volume. Adjust until the measuring phone reads approximately **60 dB** at a distance of 30 cm.
On emitter smartphone 2, produce the **same white noise** at the same volume. Individually verify that it also reads approximately **60 dB** at 30 cm.
Place both emitter smartphones **equidistant** from the measuring phone (about 30 cm), side by side.
First, record the sound level with **only emitter 1** playing for 10 seconds. Note the average value.
Stop emitter 1. Record with **only emitter 2** playing for 10 seconds. Note the average value.
Now play **both emitters simultaneously** for 10 seconds. Record the combined sound level.
Compare the three measurements. The combined level should be approximately **3 dB higher** than each individual source.
Repeat the experiment using a **pure 440 Hz tone** instead of white noise on both emitters. Note any differences in the result.
Try a third trial with **different frequencies** on each emitter (e.g., 440 Hz and 880 Hz) and compare the results.
Record all data in your FizziQ notebook and calculate the theoretical prediction using L_total = L₁ + 10 × log(2) ≈ L₁ + 3 dB.
Printable version: lab handout (PDF) with the protocol, materials and questions, for students without a screen in front of them.
Also possible with other apps: Phyphox users know this measurement as the "Audio amplitude" experiment. The protocol above works with any app that offers the same instrument; FizziQ adds the experiment notebook to record, plot and export the results, and the QR code to share the protocol with a class. See FizziQ for Phyphox users.
Expected Results
When each source individually produces about 60 dB and both play simultaneously, the combined level should measure approximately 63 dB (±1-2 dB), confirming the 3 dB rule for adding uncorrelated noise sources. White noise sources should follow this rule reliably because they are uncorrelated. For pure tones of the same frequency, results may vary depending on the phase relationship: if the waves happen to be in phase, the increase could reach up to 6 dB; if partially out of phase, the increase may be less than 3 dB. For pure tones of different frequencies (440 Hz and 880 Hz), the 3 dB rule should hold well since the signals are uncorrelated. Measurement precision is typically ±1-2 dB due to environmental noise and smartphone microphone calibration differences.
Scientific Questions
- What is the physical meaning of the logarithmic scale in the context of human hearing?
- Why might two pure tones of the same frequency produce a different result than two white noise sources?
- If you combined 10 identical sound sources, what would the expected increase in decibels be?
- How does this principle apply to real-world situations like traffic noise or a crowd cheering?
- What is the relationship between sound intensity (in watts per square meter) and sound level (in decibels)?
Scientific Background
When two sound sources of the same intensity are combined, the increase in sound level is not 100% but approximately 3 decibels. This counterintuitive property is explained by the logarithmic nature of the decibel scale.
The sound level in decibels is calculated according to the formula: L = 10 × log(I/I₀), where I is the measured sound intensity and I₀ is the reference intensity. When two identical, uncorrelated sounds are added together, their intensities (not their amplitudes) are added.
Thus, doubling the sound intensity corresponds to an increase of 3 dB. Behavior may vary depending on the nature of the sounds.
For white noise (containing all frequencies at equal intensity), the addition generally follows this 3 dB rule. On the other hand, for pure sounds of the same frequency, interference phenomena can occur: if the waves are in phase, the increase can reach 6 dB (constructive interference), while waves in opposition to phase can cancel each other out (destructive interference).
Extensions
- Gradually add more sources (using additional smartphones) and plot the sound level versus the number of sources
- Compare the addition rule for pure tones of the same frequency with tones of different frequencies
- Explore the effect of phase by trying to synchronize two pure tone sources and observing constructive or destructive interference
- Calculate and verify the theoretical prediction for combining three or four sources simultaneously
Frequently Asked Questions
The combined sound level is much higher or lower than 3 dB above each individual source. What went wrong?
Ensure both sources are producing the same volume individually (within 1 dB of each other). If using pure tones of the same frequency, phase interference may cause unexpected results; try white noise instead. Also verify that background noise is well below the source level.
Why do you recommend using white noise instead of a pure tone for this experiment?
White noise contains all frequencies at random phases, making it statistically uncorrelated between the two sources. This ensures the intensity addition rule applies cleanly. Pure tones can create phase-dependent interference effects that complicate the measurement.
Is the 3 dB rule always exact?
The 3 dB rule applies exactly for two identical uncorrelated sources. In practice, small differences in source levels, reflections, and measurement uncertainty typically produce results in the range of 2-4 dB increase.
Can I hear the 3 dB difference?
A 3 dB change is generally considered the smallest difference that is perceptible to the human ear under controlled conditions. It corresponds to doubling the sound power, though it does not sound twice as loud. A perceived doubling of loudness requires approximately a 10 dB increase.
Detailed Description
The student uses three smartphones: one to measure the sound level and two others to emit white noise. After calibrating each transmitter smartphone to 60 dB, the student measures the sound level when the two sources transmit simultaneously. The experiment is repeated with different types of sounds to analyze whether the sound increase remains constant and to understand the differences observed. FizziQ turns the measuring phone into a sound level meter via its built-in microphone, provides the synthesizer used to generate the calibrated white noise and pure tones on the emitter phones, and offers an experiment notebook to log each measurement and check the predicted 3 dB gain.
This activity is part of our sound resources. To dig deeper into measuring and analyzing sound (waveform, spectrum, spectrogram, decibels) and find all twelve experiments, read our complete guide to measuring and analyzing sound with a smartphone or computer.
Ready to start?
Download FizziQ and try this activity with your students.