
Attenuation of a circular wave
Observe wave amplitude attenuation with distance using the floats in the Waves on a Lake simulation in FizziQ Web.
Activity Summary
The student places floats at different distances from the source in the FizziQ Web Waves on a Lake simulation. They record the vertical motion of each float and measure the oscillation amplitude. By plotting amplitude versus distance, the student discovers that the amplitude decreases following a 1/√r law for circular 2D waves.
Introduction
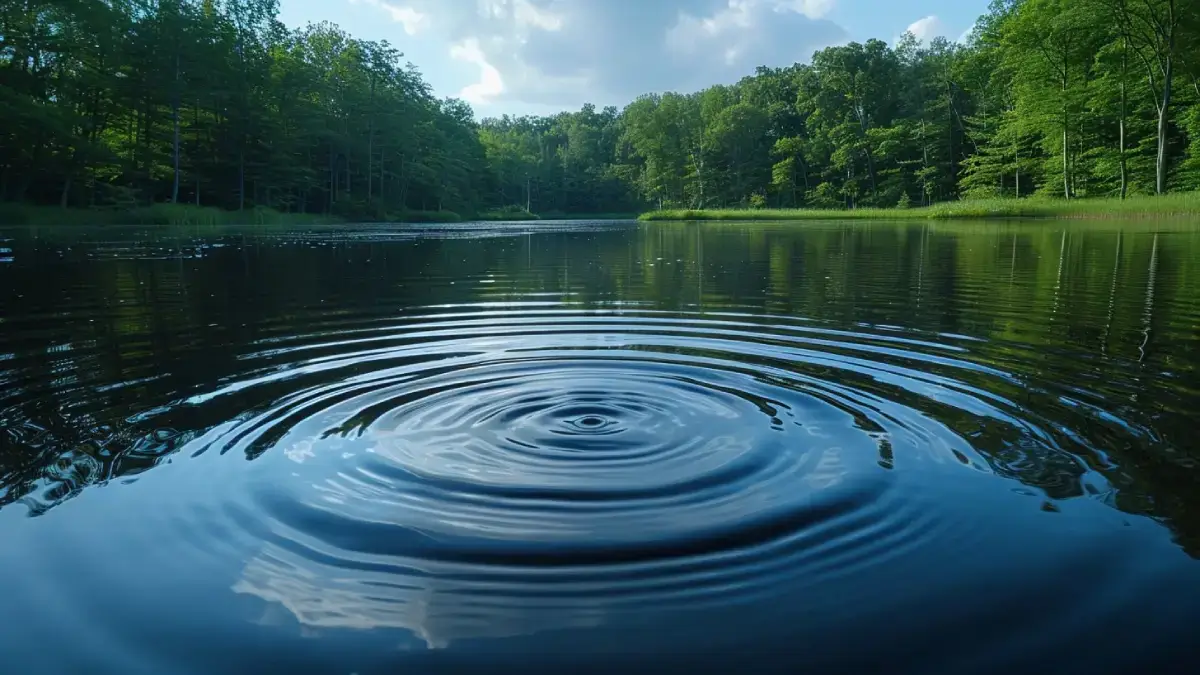
When you throw a stone into a lake, the ripples are strong near the point of impact but weaken as they spread outward. Why does the wave lose amplitude? Is it a loss of energy or simply a redistribution? The Waves on a Lake simulation in FizziQ Web lets you place virtual floats at different distances from a wave source and record their vertical motion. By measuring the oscillation amplitude of each float, you can quantify how the wave attenuates with distance and discover the mathematical law that governs this phenomenon. This is the same principle that explains why sound fades as you walk away from a speaker, and why radio signals weaken with distance from the transmitter.
Learning Objectives
- Record the vertical motion of floats at different distances
- Plot and interpret an amplitude versus distance graph
- Verify the 1/√r law for circular 2D waves
- Understand that attenuation results from energy spreading, not energy loss
Scientific Concepts
Instruments and sensors
Scientific instruments
- FizziQ Web Waves on a Lake simulation
FizziQ Features
- Experiment notebook — Used to measure each float's oscillation amplitude, build the distance/amplitude table, and plot A versus r and A versus 1/√r.
Required Materials
- - Computer, tablet, or smartphone with FizziQ Web installed - Note: the protocol remains adaptable to any comparable simulation or virtual wave-lab tool.
Experimental Protocol
Open the Waves on a Lake simulation in FizziQ Web. Set the frequency to 1.0 Hz, the speed to 2 m/s, and the amplitude to 1.0 m.
Place a first float close to the source (for example at 1 m from the center). Start the simulation and record (REC) the vertical motion of the float for a few oscillations.
Stop the recording. In the experiment notebook, measure the float's amplitude (maximum oscillation height).
Move the float to a greater distance (2 m) and repeat the recording. Measure the new amplitude.
Continue with increasing distances: 3 m, 4 m, 5 m, 6 m. Note the amplitude for each distance in a table.
Create a table with two columns: Distance r (m) and Amplitude A (m). Plot the graph of A versus r.
Is the curve a straight line? If not, try plotting A versus 1/√r. Do you obtain a straight line?
Also observe the oscillation period of the different floats. Does the period change with distance?
Launch a simulation with a larger amplitude (2.0 m). Is the relative attenuation the same?
Conclusion: the amplitude decreases with distance, but the frequency and speed remain unchanged. The wave weakens but does not slow down.
Expected Results
The amplitude decreases as distance increases. For a circular 2D wave, the amplitude theoretically follows A = A₀/√r. The period and frequency of the float oscillations remain identical regardless of distance. The graph A(r) is a decreasing curve (not a straight line), but A(1/√r) is linear, confirming the 1/√r law. Doubling the source amplitude doubles all measured amplitudes but the relative attenuation pattern remains the same.
Scientific Questions
- How does the 1/√r decay (2D) differ from the 1/r decay (3D)?
- Does the frequency of a float change with its distance from the source?
- If you double the source amplitude, does the amplitude at 5 m also double?
- Why is geometric attenuation not an energy loss but an energy redistribution?
- In what situation would a wave not attenuate at all?
Scientific Background
The **geometric attenuation** of a wave is due to the distribution of energy over an increasingly wide wavefront. For a circular 2D wave (lake surface), the wavefront perimeter equals 2πr and grows linearly with r.
The energy of a wave is proportional to the square of its amplitude: **E ∝ A²**. If the total energy is distributed over a perimeter 2πr, the energy per unit length decreases as 1/r. Therefore A² ∝ 1/r, or **A ∝ 1/√r**.
For a spherical 3D wave (like sound in air), the wavefront surface area is 4πr², and the amplitude decreases as **A ∝ 1/r** — faster than in 2D.
Important: attenuation does not change the frequency, speed, or wavelength. A distant float oscillates with the same period, just with a smaller amplitude. The wave carries less energy per unit length, but the total energy is conserved.
In addition to geometric attenuation, real waves also experience **absorption** by the medium (viscous friction, heat dissipation), which further reduces amplitude. In this simulation, only geometric attenuation is modeled.
Extensions
- Compare the motion of two floats at different distances to measure the time delay between them
- Use the measured time delay to calculate the wave propagation speed
- Investigate how the amplitude-distance relationship changes if the simulation could model 3D spherical waves
- Record amplitude data at many distances and perform a least-squares fit to verify the exponent in A ∝ r^n
Frequently Asked Questions
Do all floats oscillate at the same time?
No, more distant floats start oscillating later because the wave takes time to reach them. The delay is Δt = Δr/v, where Δr is the distance difference and v is the propagation speed.
Is the amplitude decrease due to energy loss?
No. In this simulation there is no friction. The total energy is conserved but spread over an increasingly large wavefront. Each section of the front receives less energy, hence a smaller amplitude.
Why does the graph A(r) not give a straight line?
Because the relationship is A ∝ 1/√r, which is a power law, not a linear relationship. To obtain a straight line, plot A versus 1/√r or log(A) versus log(r).
Does the wave speed change with distance?
No. The propagation speed depends on the medium, not on the distance from the source. All floats oscillate at the same frequency with the same period.
Detailed Description
The student places floats at different distances from the source in the FizziQ Web Waves on a Lake simulation. They record the vertical motion of each float and measure the oscillation amplitude. By plotting amplitude versus distance, the student discovers that the amplitude decreases following a 1/√r law for circular 2D waves. FizziQ Web's Waves on a Lake simulation lets students record each float's vertical motion directly, while the built-in experiment notebook is used to tabulate the amplitude values and plot the A versus 1/√r graph.
This activity is part of our sound resources. To dig deeper into measuring and analyzing sound (waveform, spectrum, spectrogram, decibels) and find all twelve experiments, read our complete guide to measuring and analyzing sound with a smartphone or computer.
Ready to start?
Download FizziQ and try this activity with your students.